
Here's everything you need to know to get started with Dashbird - the complete solution for End-to-End Infrastructure observability, Real-time Error Tracking, and Well-Architected Insights.
When working with AWS, One cannot emphasize enough the architectural best practices for designing workloads. One of those best practices is to design the solution in such a way that the monitoring of infrastructure and troubleshooting of errors and problems is achieved effortlessly. So much so, AWS has placed it as one of its 5 pillars of the "Well-Architected Framework"
The operational excellence pillar focuses on running and monitoring systems to deliver business value, and continually improving processes and procedures.
With over 200 products, when designing a solution, such as a micro-services based system using a number of these services at its core, it becomes rather challenging to not only monitor them but on the onset of a problem troubleshooting it and resolving it within the least amount of time becomes a daunting task. Building a monitorable system requires a deep understanding of the failure domain of the critical components, which is a tall order for a fairly complex system. Hence the need for a robust system dedicated to performing all these tasks is essential for organizations to have their systems run smoothly and keep the costs in check
Monitoring, Troubleshooting and Cost Optimization with AWS
From the AWS suite of services, there are a bunch of services readily available for all our monitoring and troubleshooting needs. To name a few, AWS CloudWatch, AWS CloudTrail, AWS Config, AWS Trust Advisor, AWS XRay, Cost Explorer are some of the services that can help to monitor services, troubleshoot problems, get insights and recommendations on best practices, and track costs for our cloud-native solutions.
Although built for the sole purpose of catering to all our above-mentioned needs, these services require very deep integrations with our systems. We have to design our solutions keeping in mind how to leverage them and make them part of our system architecture which could be a bit tricky for existing systems specifically for large complex systems with hundreds or thousands of microservices running in conjunction.
Another issue that we can relate to is that these services from AWS are almost always disjoint each working independently in their own capacity. Each service produces its own set of results which we have to examine independently for each service increasing the mean-time-to error discovery and resolution, resulting in increased overall costs and wasted effort.
Hence getting an overall view of the entire system is in a single view and tracing all the data in a single place without any code instrumentation and setup changes is fairly difficult to do at scale.
Dashbird for Monitoring, Troubleshooting, and Cost Optimization
Now that we have an idea of what set of problems we can face if we go on about using the monitoring and troubleshooting services from the AWS suite of services, it's only fair to mention Dashbird, an all-in-one tool purpose-built for providing monitoring, troubleshooting, recommendations for best practices, and cost breakdown of serverless applications with a fairly easy integration procedure. Dashbird is not just another monitoring tool. What makes Dashbird stand from their competition is not only it monitors large-scale serverless systems effortlessly but also the level of abstraction they have provided and the minimalistic integration steps. In fact, due to their novel approach, it is listed as a Cool Vendor by Gartner in Monitoring, Observability, and Cloud Operations 2021.
Dashbird approach is fairly simple, as I mentioned it's an all-in-one tool, all the mission-critical data of the entire serverless system is placed in a single dashboard giving you a birds-eye-view of the entire system activity. Moreover, we get immediate alerts on any errors or warnings that may arise and we get pointed to the exact point of failure in the system so it can be resolved.
Dashbird's Features
The 3 core pillars of Dashbird are:
- End-to-end observability for serverless.
- Automatic Failure Detection.
- Well-Architected reports.
End-to-end observability for serverless
It is the core offering of Dashbird. Under the umbrella of end to end observability we have the following feature-rich modules of the Dashbird app:
- The Dashboard --- Dashbird collects the monitoring data of the system automatically from the AWS cloud environment. The data collected(which includes logs, metrics, and traces) is then centralized, summarized on a very visually pleasing dashboard giving you real-time observability.
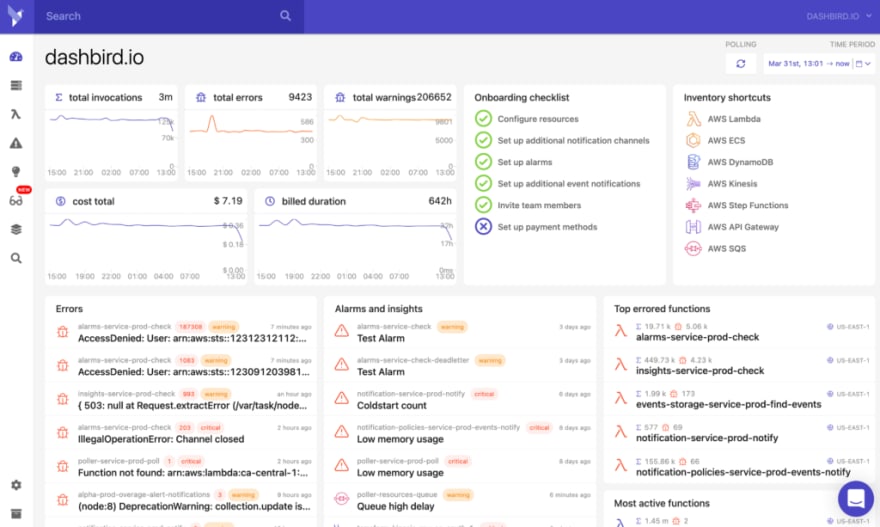
Dashbird's main dashboard
The dashboard has all the necessary information about your system which can be used closely to monitor the activity of the system. It graphically displays information regarding total invocations, total errors occurred, total warnings produced, the total cost incurred, and billed duration. It also displays which service produced what errors or warnings, what alarm went off and information regarding most frequently occurring errors and most actively used functions etc. From the dashboard, you can easily navigate to the core of the problem and take the necessary action to resolve the issue.
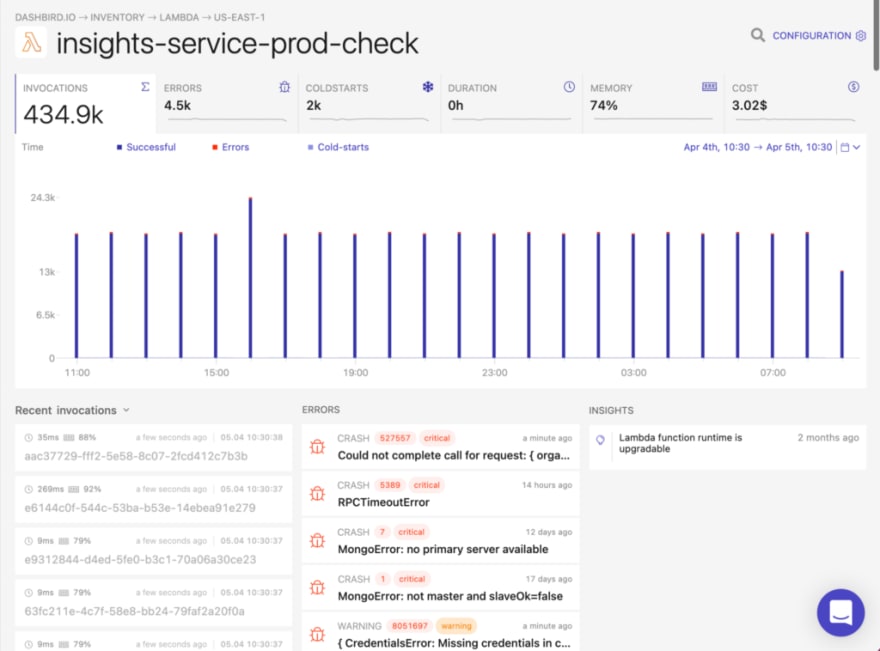
- The Inventory Service --- the inventory service is a single-pane-of-glass view for all the cloud resources(currently supported by Dashbird) of the user's system. You get complete data regarding the logs, metrics, traces, errors, and any anomalies for a specific resource. The resources are grouped and organized by type of resource.Moreover, you get a complete section for metrics for time series data, a list of executions(for lambda functions) and errors, and also any actionable insights.
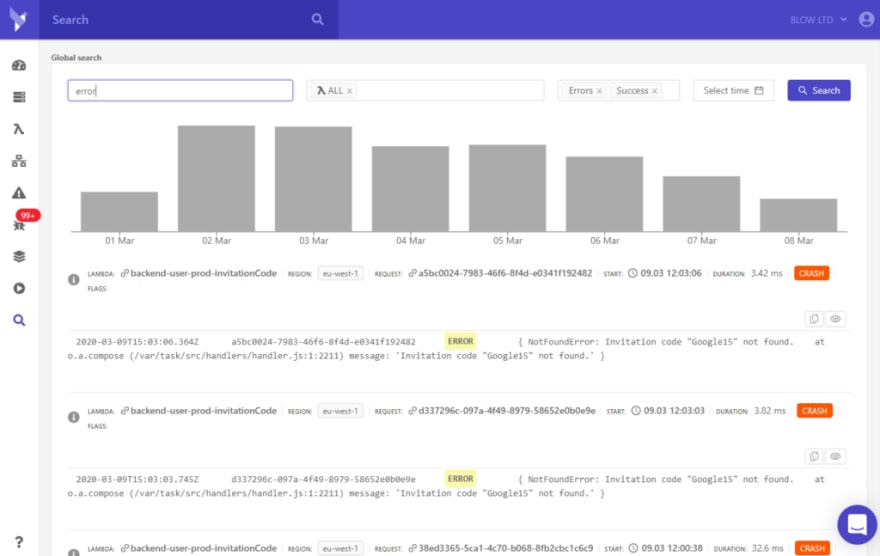
- Log Search and Analytics --- Dashbird is equipped with a very powerful log search module which is powered by ElastiSearch. You can search across logs of multiple resources at once and can filter log results based on keywords, resources, projects, status(like error or success), date range.
- Resource Groups --- Resource Groups allow you to group and organize several resources together specific to a business use case. This allows us to debug all the resources in a resource group as a single unit which could be rather difficult if debugging is done individually for each resource. A custom metrics board is created for each resource group or project to allow you to see system-wide metrics.
Automatic Failure Detection
Coming towards the 2nd offering by Dashbird, automatic failure detection keeps you well informed of any errors, exceptions, or anomalies that may arise in your system. Dashbird monitors the logs in real-time keeping an eye on the entire system and sends out proper alerts if something seems off e.g. it will trigger an alarm in case of a lambda function time-out failure or out of memory failure. Dashbird's event library covers errors and anomalies for AWS Lambda, Kinesis, SQS, API Gateway, DynamoDB, Step-Functions.
Other than its own alarms on predefined metrics, Dashbird also allows you to create custom alarms for any metric condition you deem fit. And to keep well informed, Dashbird easily integrates with SNS, email, Slack, and webhooks as its Notification Channels to alert you in case of an error.
Well-Architected reports
Finally, we have the well-architected reports offering. Dashbird conducts an assessment of your current system architecture and benchmarks them against the industry-wide accepted architectural best practices and generates a report for you to see in which domain of the well-architected framework your existing system stands and also shares recommendations on how you can improve on the discovered shortcomings.
The assessment covers the five pillars of the well-architected framework:
- Security.
- Reliability.
- Performance Efficiency.
- Operational Excellence.
- Cost Optimization.
There are over 100 complex insight rules that dashbird uses to figure out architectural improvement opportunities in your existing architecture. And the best thing about this feature is it is free to use for up to 1M invocations.
Getting Started with Dashbird
Getting started with Dashbird is really simple.
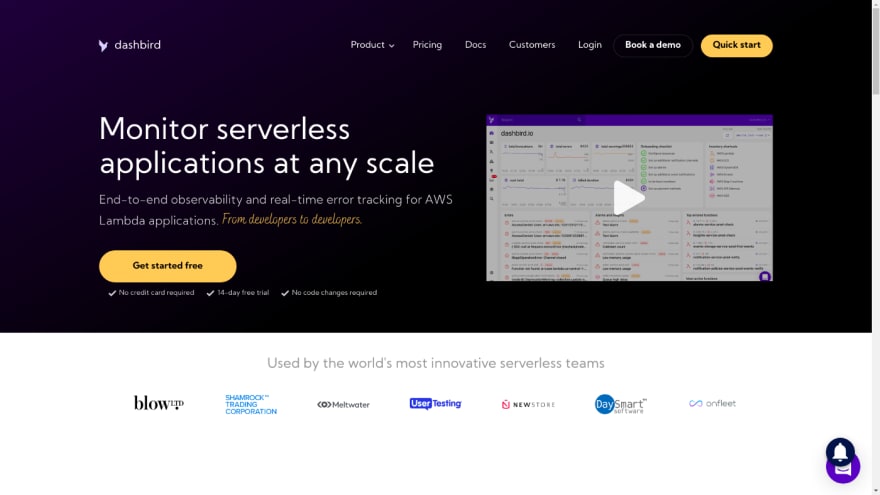
- Go to Dashbird.io and click on "Quick start".
1- Setting up Dashbird
- You'll be asked to provide an email and password
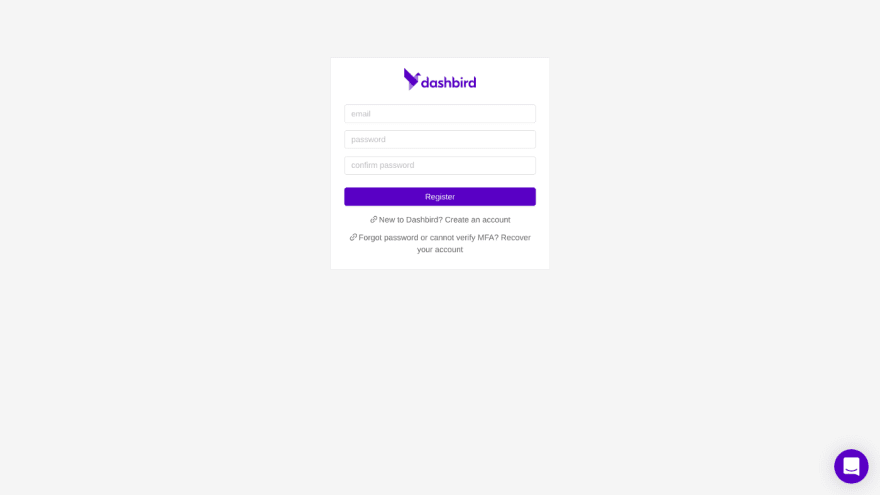
2- Create New Account
- After confirming your email you'll be redirected to the following screen. Enter a suitable name for your organization. Then click "next".
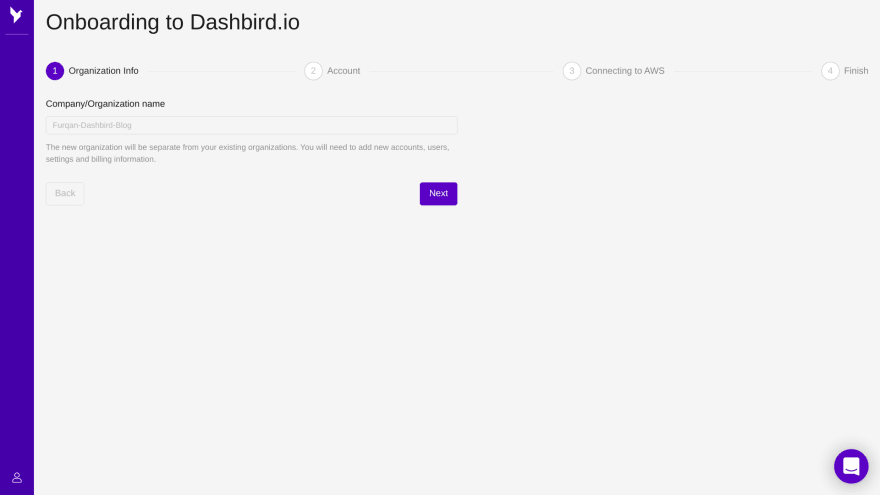
3- Onboarding Dashbird.
- Next, enter a name for your project and select what you are expecting to get by using Dashbird.

4- Onboarding Dashbird.
- Now we connect our AWS account with Dashbird. Dashbird has created a CloudFormation template that automatically creates a role in your AWS account delegating read-only access to various services in your account. Dashbird uses this role to get the metrics, logs, and traces data for the services in your account.
- Just click on the "Add Dashbird CloundFormation Stack to AWS" link and you'll be redirected to CloudFormation Console in your account. There click on the create stack and Dashbird stack will be created shortly. Once the stack is created you just have to copy the DashbirdDelegationRole ARN from the outputs tabs in the CloudFormation console and submit it in the dashbird's onboarding as can be seen below.
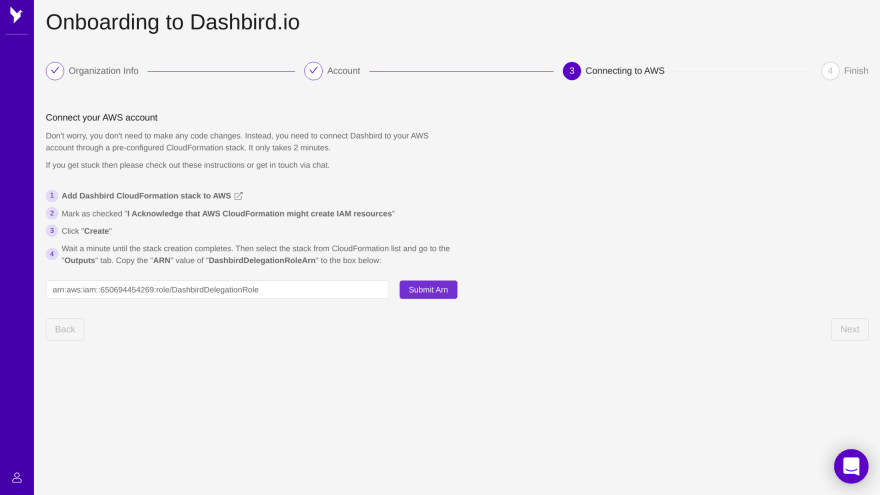
5- Connecting Dashbird with AWS

6- Create Dashbird CF stack.
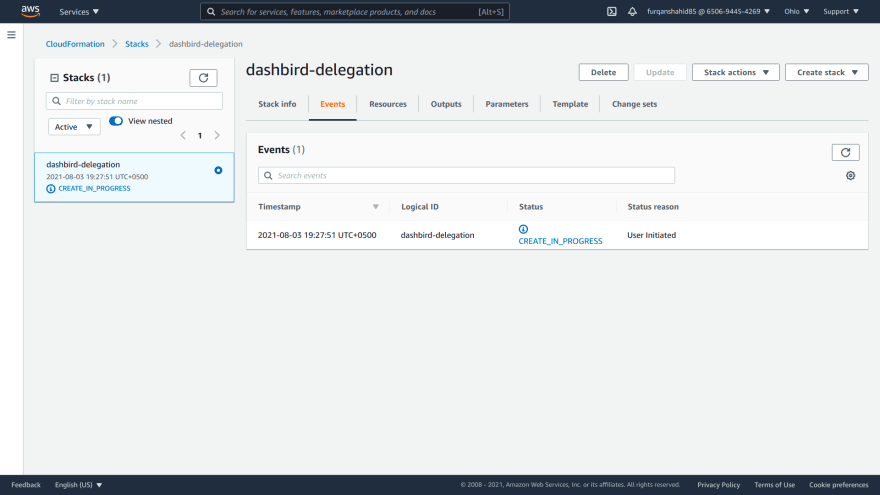
7- Dashbird CF stack creation.
- We are finally done with the onboarding process with just one last step left. After you have submitted the ARN and clicked next dashbird will now automatically fetch metrics, logs, and traces information of the resources in your account. This step will take only a couple of minutes. Once complete you'll be redirected to the Dashbird dashboard. And that's it - after the 2-minute onboarding process you are done and can start debugging and working with your data immediately!
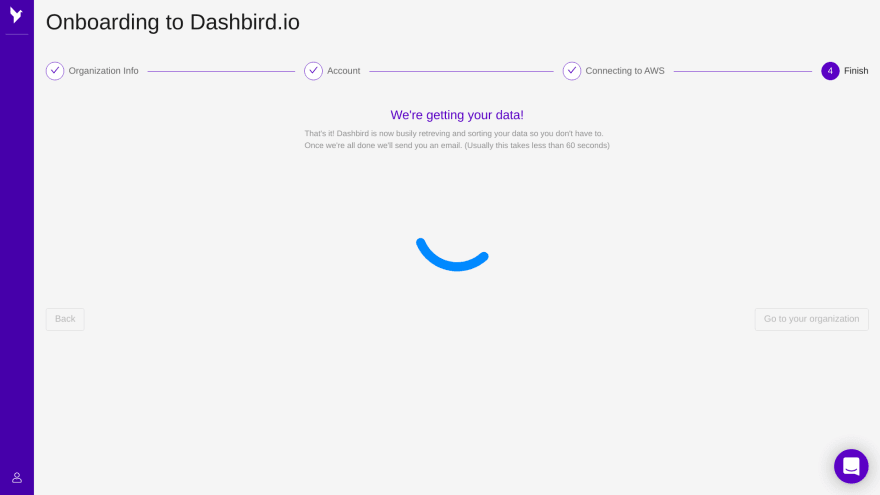
8- Fetching Account Data.
AWS Services Supported by Dashbird
As of now, Dashbird provides support for the following AWS services:
- AWS Lambda.
- AWS Kinesis.
- AWS ECS.
- AWS SQS.
- AWS API Gateway.
- AWS DynamoDB.
- AWS Step-Functions.
Dashbird is working on including more services under its umbrella.
Billing Model
Dashbird has 3 billings options available.
1. Free: The free plan is specifically created for developers and provides all the basic features such as infrastructure monitoring, failure detection, log analytics, etc. The free plan provides you with upto 1M invocations.
2. Standard Plan: Suited for large serverless environments. Provides all the features Dashbird has to offer. The plan can be adjusted based on your invocations per month starting from 2M invocations up to 15M invocations per month.
3. Enterprise Plan: the enterprise plan is for very large organizations with thousands of employees and hundreds of systems running. Dashbird provides all professional plan features and additional enterprise grades features with this plan.
To learn more about the billing and pricing of Dashbird visit this link.
Further reading:
Monitoring vs Observability: can you tell the difference?
Bullet-Proofing Serverless Infrastructures with Failure and Threat Detection
Introduction to Dashbird's Automated Well-Architected Reports

Top comments (0)