
[Photo by Andrew Neel on Unsplash, modified(crop)]
In the previous installments we laid the foundations for our infrastructure.
It is time now to produce some maps!
Please notice that this cannot be a detailed tutorial, it is more like a quick summary of the work done, with some commentary.
Mapbox
When I first started doing web maps there were less tools and companies involved in the process. As of today many companies have come and gone, so it is difficult sometimes for an lay man to get started in geography.
That is why you have to sort of trust me in this. For this project we will not use Google Maps, although it is a very popular and trusty too. We will use Mapbox, also because even though it s less known, in the open source web map world is gaining lot of traction.
Point your browser to the Mapbox registration page if you do not yet have an account, and follow the easy instructions

After confirming your email you can go to your account page in order to generate a new token (an API key)

Once you have created a token, we need to save it on an .env file to be put inside the service repository, not the bot.
Here we did not have an .env file, so just create one
MAPBOX_TOKEN=***
MAPBOX_URL=https://api.mapbox.com/v4/mapbox.satellite
We will use the URL later on.
Now we will see how to use that token
Web Maps
There are several standards for web maps, however here we will use a not so standard slippy map, which is sort of WTMS, but it follows the standards loosely.
What we need to know is the following: the map gets rendered at different zoom levels as a mosaic, that is, a series of tiles, or square 256×256 pixel images, one besides the other. if you zoom in, each tile is subdivided in 4 tile, if you zoom out, 4 tiles are collapsed into one tile.
The zoom level 1 shows the whole world inside a single tile, at zoom level 2 the world fits neatly in 4 tiles, while at zoom level 3 there are 16 tiles to represent the whole world.
I think this is sufficient as a quick introduction to the subject matter.
However, there's still a problem: how to get locate on a map any geographic point (usually given in the latitude/longitude notation)?
There's a mathematical equation that does this, and if you want to know more, read this article by OpenStreetMap.
These are the two formulas:
def deg2num(lat_deg, lon_deg, zoom):
    lat_rad = math.radians(lat_deg)
    n = 2.0 ** zoom
    xtile = int((lon_deg + 180.0) / 360.0 * n)
    ytile = int((1.0 - math.asinh(math.tan(lat_rad)) / math.pi) / 2.0 * n)
    return (xtile, ytile)
While the reverse:
def num2deg(xtile, ytile, zoom):
    n = 2.0 ** zoom
    lon_deg = xtile / n * 360.0 - 180.0
    lat_rad = math.atan(math.sinh(math.pi * (1 - 2 * ytile / n)))
    lat_deg = math.degrees(lat_rad)
    return (lat_deg, lon_deg)
For both we need to import Math
Get a Map of a Bounding Box
Time for action!
We will do the following
- Define an API interface to get a Map as an image, given a bounding box (W, N, E, S)
- Retrieve the necessary tiles
- Process those tiles into an image
Easy? Let's see...
First things first: Mapbox already has a static image API, that gets you an image out of a bounding box (it actually has some good advanced options).
So, why don't we use it? Well, we could use it, but we will not be able to customize much the experience for our users, let alone making this a more universal geography system.
Therefore, if it is needed as quick-fix to scaffold the structure we can use ready made functions, but if we want to squeeze out something more for the user experience, we need to go the indie way.
That said, let's go forth and create the API interface.
source venv/bin/activate
pip install urllib3 Pillow geojson overpy
pip freeze > requirements.txt
We installed the following packages:
-
urllib3handles connections -
Pillowis for image manipulations -
geojsonhandle a specification of JSON called GeoJSON used for transferring geographic data as JSON (Wiki article and the Official Specification) -
overpyis a tiny layer for requests to the Overass API; it allows to query the data from the OpenStreetMap
The API will be defined as follows:
@app.route('/api/bbox/<float:w>/<float:n>/<float:e>/<float:s>', methods=['GET', 'POST'])
def show_bbox(w, n, e, s):
    pass
Now we need a function to retrieve the tiles from the tile-server and one to process those tiles into a single file.
I've made a custom library that does just that. But it took me the most part of this hackathon!
The library is in the folder geobot/ of the repository. I will quickly review what each component does.
Bear in mind that this was a quick development, not everything has been documented properly.
The geo.py Geographic utilities
Here there are some classes (some dataclass actually) and helper functions to deal with the geographic coordinates (Latitude, Longitude)
-
LonLatrepresents a point as (Latitude, Longitude) coordinates -
Tilerepresents a bounding box, with coordinates (West, North, East, South) -
Tilerepresents a tile to be got from the tile-server
The tileget.py Interface with the tile-server
It contains a class, Tileget, that handles the tile retrieval from the tile-server
The temps.py Temporary Files and Folders Utilities
In the Python standard library there are already means to get Temporary Files and Folders ; however, here we need them temporary, but they have to get around quite a lot... We needed something different to handle our images.
The tiledraw.py Tile-to-Image Interface
Tiles from a tile-server are not only images. They are geo-referenced images, that is, they carry their geographic location information about them.
The Dtile class handles tiles that can be drawn upon. It has got a simplistic (for now) way of rendering GeoJSON on them, add a watermark for copyright notices, resize and crop, maintaining the geographic information needed even after the image manipulations.
The overpass.py OSM Data Interface for GeoJSON
There are some helper classes and functions to retrieve information from OpenStreetMap, and render it as GeoJSON.
As for now it is just a stub, but it should be more developed, in order to get some POI, Points of Interests out of the map and mark them on the images
The tiledraw.py Tile Render Engine
Here we have the utilities to download the tiles, prepare an image out of those tiles, and render it as normal image
The Working Endpoints
For now, only two endpoints are working
@app.route('/api/bbox/<float:w>/<float:n>/<float:e>/<float:s>', methods=['GET', 'POST'])
This endpoint returns a bounding box image.
@app.route('/api/point/<float:lon>/<float:lat>', methods=['GET', 'POST'])
This endpoint calculates a bounding box near the specified point and returns the image.
Testing locally, we can see that easily working.
We need to run the local gunicorn server:
gunicorn app:app
NOTE, if it is not working, maybe you need to get the environment file to be read by the virtualenv:
deactivate
echo "set -a; source $(pwd)/.env; set +a" >> venv/bin/activate
source venv/bin/activate
echo $MAPBOX_URL
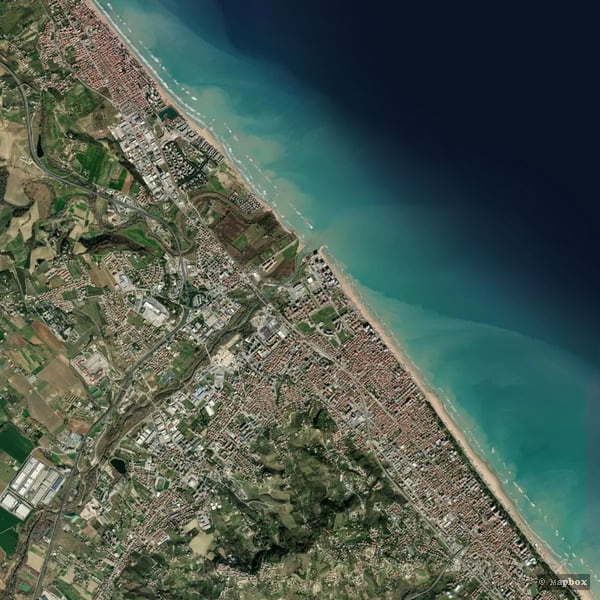
When it works, in a separate shell, we ask for the file image:
curl --output file.png 'http://127.0.0.1:8000/api/bbox/14.141636/42.522977/14.184637/42.497605'
We can also ask for an image near a point, let's say, in a 30 meters radius:
curl --output file.png 'http://127.0.0.1:8000/api/point/14.141636/42.522977?near=30'
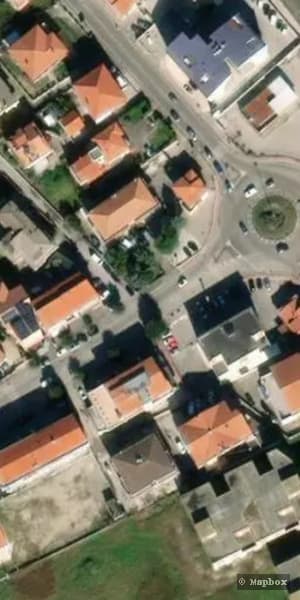
Notice that the Geobot performs an harmonious scaling, basically maintaining some of the proportions of the tile-set it retrieved according to the geographic detail needed. In this way, if a bounding-box belongs to 2 vertical tiles, you will see an image taller than higher, not a square image.
If you want to search for bounding box to try to show, I recommend visiting the following site:
Try it, and build your own queries.
Last, but not least, the GeoJSON capabilities. Both endpoints in fact can render arbitrary GeoJSON
I left a GeoJSON test file in examples/
You can use it as follows:
curl -X POST -H "Content-Type: application/json" -d @examples/fountains.geojson --output file.png 'http://127.0.0.1:8000/api/bbox/14.141636/42.522977/14.184637/42.497605?cropped=1'
Notice that adding the cropped parameter crops the image to the bounding-box, before scaling it.

The GeoJSON used was extracted with a Overpass Query from OSM data, transformed to GeoJSON and fed to the endpoint.
The same result can be obtained using the api/poi_bbox/ endpoint. This endpoint accepts some Point of Interest (PoI) names to search with Overpass inside the bounding-box.
In examples/ there's a file calld poi.json containing the query to be fed to the api/poi_bbox/ endpoint. The format is really simple: an object with a 'poi' key, and a list of names of Point of Interest:
{"poi": ["fountain", "drinking_water"]}
You can feed it to the API as such:
curl -X POST -H "Content-Type: application/json" -d @examples/poi.json --output file.png 'http://127.0.0.1:8000/api/poi_bbox/14.141636/42.522977/14.184637/42.497605'

This time the resulting image was not cropped, but the search has been done only inside the bounding-box, that is why the image covers more area (according to the tiles downloaded), but the markers are shown only for certain elements (again, only those inside the bounding-box). That is why in this setting the cropping utility works best.
Interfacing the TwitterBot
From a tweet we can get the location; we are going to exploit this in order to get a map near the user location.
Notice that the user has to have allowed beforehand the position in their Twitter interface, otherwise there will not be any information.
The information itself can be in several places, marked as coordinates. For this reason, we have to try several things. Also the information can be as a pint, or as a bounding box, according as the user specified a simple point location or a place (extended).
Besides, the information can be presented as a Geometry or otherwise... We will use a regex to extract the coordinates, and parse them.
It's long and tedious, but it must be done...
At the end, mentioning the bot in a geo-located setting works...

However, if the location is not precise (for example, selecting the city, instead than the neighborhood or a nearby Point of Interest) results in more errors than nothing
In fact, above I was hoping it showed the city, and instead it showed an arbitrary point inside the city.
This happens because the coordinates provided by Twitter are not so ideal

Here instead I put a famous local bar as location, and it got me the image all-right.
Developing some more
Just to show a little bit the power of the underlying platform, I refactored the code and added a new function.
THis new function basically checks for earthquakes through the quakefeeds library, which uses the web services provided by the USGS.
In practice it searches for the last earthquakes (last hours), for new ones. The level is set to retrieve only the significant ones, but it can be tweaked to some magnitude levels, or to get them all.
Once it retrieves the information, it creates a message with the most important points, and a link to the info on the earthquake at the USGS's site.
Then it retrieves a map centered on the epicenter with a 10km radius from the Geobot server.
Finally it posts the picture with the relevant information.

Conclusion and future developments
We have shown so far a series of capabilities of the library we've created, and the API developed so far.
However, the library allows for much more than what covered in the API.
For example:
- the library is capable of customize the markers, the colors, using different icons as marker
- the library can return GeoJSON in exchange for a Overpass Query (there's a more generic builder for it), or a search by PoI
- the library can return the tile-sets as GeoJSON bounding boxes, useful in order to extrapolate these info while browsing maps online (to add functionalities to layers of map rendering software, as for example leaflet.js)
All these capabilities are already present in the library: it is just a matter of finding the best way to expose them with a web API.
In addition to these, there can be much more functionality to be added to the API with a minimal effort.
For example an endpoint could be created to easily search for bounding-boxes based on names (for example the name of a city, and a rough bounding-box covering it).
The bot can be further developed, either with new possibilities, or copying the same functions over to other networks or communications systems (Facebook, Telegram, Slack...)
Again, there are many possibilities for such a fast growing field.
In fact, the market for end-customer geographic web application is getting reaper and reaper by the day, and niche products can still cut a slice of shares out of bigger companies, in my honest opinion.

Top comments (0)