
No one’s talking Swing’s retirement – despite it being in its golden years. As you probably imagine, it is the most heavily used JAVA library for GUI creation. Which is well justified as Swing-based applications can be of any complexity and will look (and work!) the same when run on any OS. There’s, of course, a price to pay: as your application becomes more complex and accumulates lots of custom graphics, you’re bound to run into problems with performance and response speed.
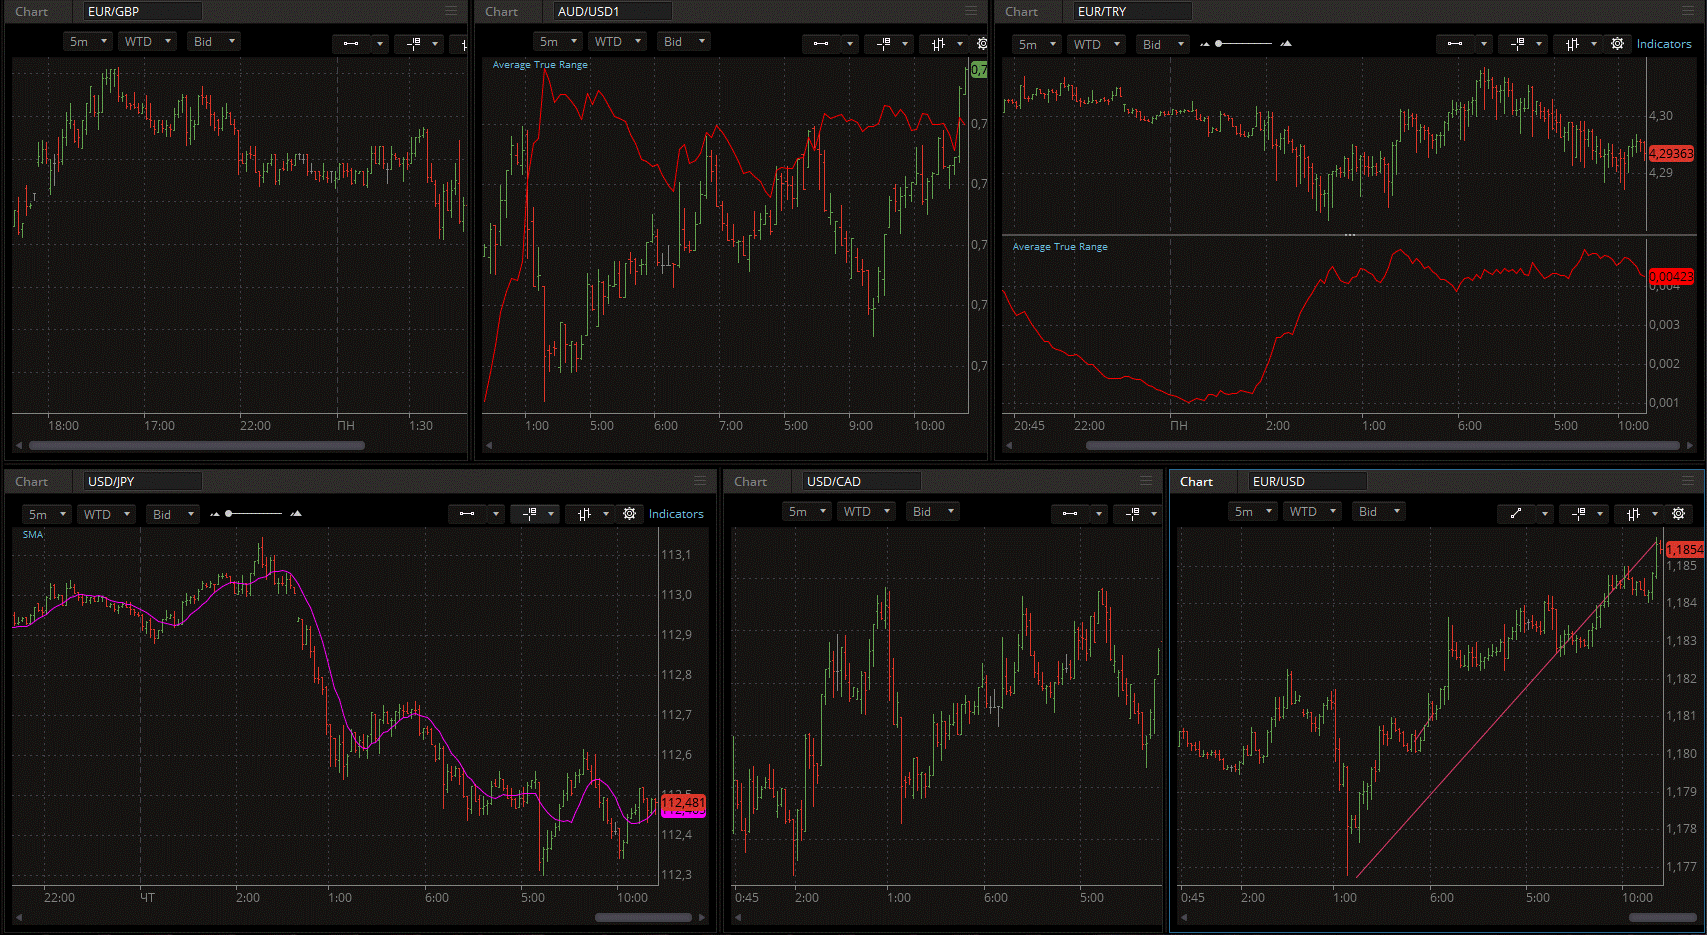
At Devexperts, we develop an application of this kind, which is a trading platform for brokers. With huge amounts of graphics in numerous windows, this application is designed for usage in multi-monitor configurations (see the screenshot below) – so you may be surprised to learn that its client is entirely Swing-based.
Here, we’ll be discussing what you should keep in mind when working with Swing. We’ll also be sharing some tips and tricks to boost your application’s performance.
SAMPLE APPLICATION
To keep things simple, we’ll be discussing all of our examples in the context of a really basic sample application, nothing too crazy. Since it is graphic interfaces that we’re gathered here for, we’ll choose the application accordingly. Let’s draw 500 rectangles of miscellaneous sizes and also a circle as a mouse cursor. Our very first implementation of this application will look like this:
public class MouseCirclePaintingComponentForSlide extends JPanel {
  private Point currentMousePoint = new Point(-1, -1);

  MouseCirclePaintingComponentForSlide() {
      addMouseMotionListener(new MouseAdapter() {
          @Override
          public void mouseMoved(MouseEvent e) {
              currentMousePoint = e.getPoint();
              repaint();
          }
      });
  }

  @Override
  protected void paintComponent(Graphics g) {
      super.paintComponent(g);
      Graphics2D g2 = (Graphics2D) g.create();

      // paint 500 rectangles
      // paint mouse cursor

      g2.dispose();
  }
}
Launching this application on an average machine will most definitely result in the following:

The first thing you see is the lag between the mouse movement and the rendering of the circle. While it’s not exactly rocket science to find out the reason behind the lagging (spoiler: 500 rectangles, Carl!), let’s pretend the application is complex and this reason is yet to be revealed. In real life, we might as well collect metrics upon each release to see if the lagging situation has worsened in our most recent build. Which is why the number one thing to be discussed here is measuring performance of the drawing code.
TO THE PROFILER!
One can expect that the most basic and obvious approach is to measure the runtime of the paintComponent method. What could possibly go wrong here? Let’s see! A sample code could be something like this:
@Override
protected void paintComponent(Graphics g) {
    super.paintComponent(g);
    long start = System.nanoTime();

    // paint rectangles here

    long elapsed = System.nanoTime() - start;
    System.out.println("paintComponent: " + TimeUnit.NANOSECONDS.toMillis(elapsed) + " ms");
}
Everything’s cool, we’ve done this before like thousand times. Launching the application, we’ll see the following:
paintComponent: 0 ms
paintComponent: 0 ms
paintComponent: 0 ms
paintComponent: 0 ms
paintComponent: 0 ms
paintComponent: 0 ms
paintComponent: 0 ms
paintComponent: 0 ms
The figures are at least confusing. Are the rectangles really being drawn this fast? We’re having a hard time believing that, considering the obvious cursor lagging! Let’s see what’s in the profiler then.
Having our application profiled, we’re getting curious results: AWT is just completely idle! What is going on here? To answer this question, we might as well take a look at the profiler once again. In the thread monitoring charts, you can see this D3D Screen Updater thread working on something while the AWT is inactive. Dig this a bit deeper and you will see that AWT is not just being inactive, it is waiting for something. And this something happens to be D3D.
Here, a brief digression is needed: you will not see this AWT-D3D thing on every single machine (not to mention you can only see D3D on Windows). It’s also possible that based on your hardware parameters, you cannot observe any extra threads at all – but that’s more of an exception.
So, back to our question – what is really going on with these threads? The thing is, when you’re executing a painting method like drawLine or drawRect – drawing isn’t really happening. Swing is trying to enable hardware acceleration – which, in this case, is D3D – and when painting methods are called, commands are recorded to a special buffer (RenderBuffer). The drawing, on the other hand, is completed a bit later, at the moment the Repaint Manager completes the drawing cycle of the image command copy on the screen. This is also the moment the control is passed on to the D3D thread, which executes all of the commands stored in the buffer. Which means the AWT will be waiting until D3D is finished.
MEASURING 101
So, how do we measure the method execution time? There are actually several ways to do so. First is simply turning off the hardware acceleration using the corresponding flag. This will force Java to independently do the drawing in AWT. Of course, it’s not exactly a straightforward measuring method, but it will allow us to at least measure some of the relative metrics. For example, we’ll be able to define how slowly a component is drawn compared to another component. The profiler will also show real data. Now we see that the entire time is spent on drawing the rectangles.
As an alternative, we can measure execution time of the paintImmediately method.
There are other means of profiling that do not require turning off the hardware acceleration. These are not always precise (when measuring a single component) and are more suitable for evaluation of the overall response of an application or when comparing a new build with a previous. Long story short, they may prove quite useful in a complex application.
Let’s kick off with a technique that is redefining the standard repaintManager and logging the execution time of the paintDirtyRegions method. An advantage of this approach is that it allows us to get the exact metric of each iteration in AWT (including the D3D waiting time). On the other hand, its coverage is so large that we can’t really determine which component takes the most time to be drawn.
Up next: a substitute for EventQueue. If we replace EventQueue with a custom queue, we’ll be free to redefine the dispatchEvent method and measure the execution time of each event in the queue. In addition, this will allow us to measure the delay before execution for some of the events. As a rule of thumb, this can be done for an event that has the getTime method that returns this particular event’s creation timestamp. Basically, these are mouse events, repainting events, and some others. Repainting events in this queue are generally represented by the InvocationEvent class. Sometimes this class represents other events, but on the whole, it does not affect the measurements.
So, here’s the most basic example of such a queue.
public class MonitoringEventQueue extends EventQueue {
  @Override
  protected void dispatchEvent(AWTEvent event) {
      if (event instanceof InvocationEvent) {
          InvocationEvent invocationEvent = (InvocationEvent) event;
          long waitingInQueueTime = System.currentTimeMillis() - invocationEvent.getWhen();
          System.out.println("In queue: " + waitingInQueueTime + "ms" + " : " + event.toString());
      }
      long start = System.nanoTime();
      super.dispatchEvent(event);
      long elapsed = System.nanoTime() - start;
      System.out.println("dispatchEvent: " + TimeUnit.NANOSECONDS.toMillis(elapsed) + " ms");
  }
}
This approach is efficient and convenient, especially when you have to measure the overall response of an application – and it allows freeze capturing! For example, you can message the user in case some event has spent too much time on the queue.
We use this approach at Devexperts in performance testing of each new version of the UI client.
OPTIMIZATIONS: BACK TO CLASSICS
So, we have somewhat successfully measured the performance, it’s time to go back to our initial problem: how to optimize the sample application so the cursor lagging is removed? We know that in our case the slowness is blatant when drawing the rectangles. By the way, in most of the cases, it is simple rendering operations that appear to be the bottleneck.
Let’s look closely at the code of the mouse handler. Is there a problem with it? It’s well evident that the cursor is only 20 pixels, but we’re still repainting the entire component.
That’s costly! Calling the repaint method without specifying the repainting area is a common mistake in many Swing-based applications. Let’s re-write the code so it only repaints the necessary areas. Basically, we only need to repaint the region the cursor was initially at and the region it went to. Yes, it’s that simple.
@Override
public void mouseMoved(MouseEvent e) {
  currentMousePoint = e.getPoint();
  repaint(lastPaintedPoint.x - 15, lastPaintedPoint.y - 15, 30 , 30);
  repaint(currentMousePoint.x - 15, currentMousePoint.y - 15, 30, 30);
}
Having launched the application, we see that the performance has dramatically increased. A great thing about this approach is that we don’t even have to check clipBounds in the painting code (in the current implementation). The graphics can easily detect that we’re trying to draw rectangles and spend no extra time on that. On a side note though, clipBounds should always be taken into account whenever it’s possible.

Let’s make our example a bit more complex. What if we need to visualize the cursor position with crosshairs, not a circle? Let’s see… Using the same optimization as we did in the circle example will not result in any performance enhancements. It’s going to keep lagging as it did before.

The thing is that when calling repaint, no painting is happening and RepaintManager only records the dirty region. It also does Region extension, which is, in fact, merging several dirty regions into a single larger one. Although it has worked for the circles, crosshairs are a bit more complicated as merging the horizontal and the vertical line takes the entire display. It’s a shame, what should we do then? One of the possible options is using our own back buffer. If we once render the rectangles there and then just copy those upon each rendering, it would take much less time than drawing 500 rectangles. However, we’re not going to be contemplating this approach now. Let’s see what other options we have.
SYNCHRONOUS PAINTING
As the matter of fact, the problem of the repaint method is not just merging the repaint regions. We may also face a problem in it being asynchronous, which results in the repainting event finding itself in the queue so a small lag is inevitable. If the queue also contains other events, this lag increases. Wouldn’t it be nice if we could repaint the mouse cursor immediately in the mouse event handler? And we do have means for that! In Swing, there is an option of calling the paintImmediately method on the component. When calling this method, the painting of the component is immediately done. Also, when calling this method multiple times, repaint regions are not merged. Now let’s use this approach in our code:
@Override
public void mouseMoved(MouseEvent e) {
  currentMousePoint = e.getPoint();
  // erase old
  paintImmediately(0, lastPaintedPoint.y, getWidth(), 1 );
  paintImmediately(lastPaintedPoint.x, 0, 1, getHeight());
  // paint new
  paintImmediately(0, currentMousePoint.y, getWidth(), 1);
  paintImmediately(currentMousePoint.x, 0, 1, getHeight());
}

Launch to see that the lag has sufficiently decreased and the application works much faster. However, we need to take into account that we’re calling the same painting code several times with different repaint regions. This is why it’s crucial that we also make the code take into account the region so no extra operations are performed. In our example we’re not doing this for the sake of keeping things simple.
The synchronous painting approach does have a multitude of advantages, but we can observe some drawbacks as well:
The paintImmediately method should always be called in AWT, which is not the case with the repaint method
Upon calling this method each time, many things happen, including double buffering. Given we call it four times in our example, the overhead is quite serious.
Generally, the painting code when using this approach is more complicated as we need to account for the repainting regions. Although in the perfect world, this should always be done, whatever the approach is.
In fact, we should be concerned the most about the drawback #2. Can we actually avoid calling such a heavy method four times? It seems that we can!
TIME TO GET ACTIVE
Active painting is an interesting solution to our problem. First off, why is it called active? Well, that’s because we’re now painting by ourselves directly on-screen, controlling the entire process. Thankfully, Swing gives us this opportunity. To do so, we can use the getGraphics method present in each of the Swing components so we paint avoiding any other Swing mechanisms. Of course, the burden of the painting optimization is now ours to take, but we’ll happily take it, won’t we? There are several special things about this approach that are worth mentioning:
The getGraphics method may return null, so before we start taking any actions, we’d better ensure that the object exists.
We’re going to paint directly into the screen buffer of the component, meaning above anything painted there by Swing itself. That’s why we’ll have to address the problem of cleaning out and repainting of the necessary component region. This also means that we can paint something extra incrementally.
The paintComponent methods can be called by the framework even without our participation (e.g., upon the OS request) so everything you paint should be duplicated there (of course, only if you absolutely need it). When drawing the crosshairs, it may not be obligatory, but it’s still worth remembering.
Taking all of this into account, let’s re-write our example. Since we need to restore the image after each crosshairs rendering, we’ll record the image in our own buffer to avoid many complications.
addMouseMotionListener(new MouseAdapter() {
  @Override
  public void mouseMoved(MouseEvent e) {
      Point mousePointNow = MouseInfo.getPointerInfo().getLocation();
      SwingUtilities.convertPointFromScreen(mousePointNow, MouseCrossActivePaintingComponent.this);

      Graphics graphics = MouseCrossActivePaintingComponent.this.getGraphics();
      if (graphics == null)
          return;
      Graphics2D g2 = (Graphics2D) graphics.create();

      // erase previous cross by restoring rectangles from image
      g2.drawImage(backBuffer, 0, 0, null);

      g2.setColor(Color.BLUE);
      g2.drawLine(0, currentMousePoint.y, getWidth(), currentMousePoint.y);
      g2.drawLine(currentMousePoint.x, 0, currentMousePoint.x, getHeight());

      lastPaintedPoint = currentMousePoint;
      g2.dispose();
      Toolkit.getDefaultToolkit().sync();
  }
});
In the above case you may notice that we get the mouse position from the MouseInfo class, not from the event. This little trick lets us further decrease the lag of the cursor from the real mouse position. The coordinates recorded in the event might differ from the real ones because the event has already spent some time in the queue before being handled.
Now the cursor lag is completely eliminated.
SUMMING IT ALL UP
Our discussion has only covered a small (yet important) part of nuances specific to working with Swing. A real-life application is likely to include tables, lists, trees, etc., in addition to the custom graphics we’ve taken a short dive into. No matter how hard we try, fitting specifics of these controls into a single article is next to impossible. But here’s a thing to remember: the total performance of an application depends on that of its elements. If there is an element that lags behind, there’s no way others will catch up.
Thanks for reading!

Sergey Lukashevich, Technical Lead at Devexperts

Top comments (0)