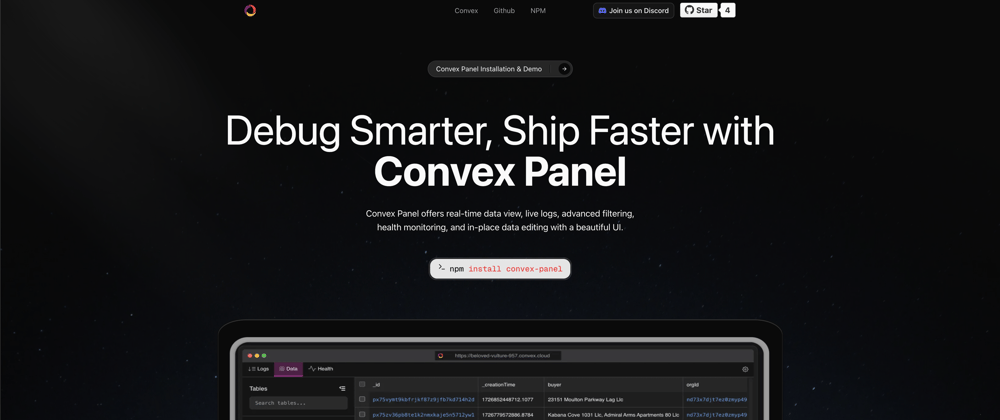
Why I built convexpanel.dev and what it means for my workflow
When I first started using convex, I realized how awesome and easy it was to use the dashboard. It offers an amazing overview of logs, the ability to edit table data, and view your app health. However, as a developer who always has an insane amount of browser tabs open, I found myself constantly switching back and forth just to check on things, and with the massive amount of tabs, I always spent more time looking for the dashboard tab than I did looking at it. Even though I could use the Convex CLI to open the dashboard directly, there was still that nagging need for a more streamlined, integrated experience.
The Spark Behind Convex Panel
After countless times of having to hunt down my convex dashboard tab, I thought: Why not build something that brings the dashboard directly into my development environment? I wanted something that allowed me to do numerous things.
- View logs without leaving my dev environment
- Being able to edit tables directly within my dev environment
- View my data analytics / function rates quickly
The desire to reduce wasted time looking for a browser tab (having a cluttered browser doesn’t help) led me to build this awesome tool. A tool designed to integrate the key features I love from the Convex Dashboard directly into my development environment.
The Initial Approach: A Chrome Extension
My first thought was to build this as a Chrome extension, I figured it would be nice to have something accessible directly in my browser. The idea was simple: have a side panel that could display logs, table data, and function analytics while I worked in the browser. This seemed like the perfect solution—until I ran into security issues and the realization that maybe not everyone uses Chrome.
Convex requires authentication and access tokens to gather data, and Chrome extensions are highly restrictive when it comes to handling sensitive credentials. Storing API keys in local storage or extension settings felt like a security risk, and I didn’t want to force users to manually authenticate each time they opened the extension. Additionally, interacting with the Convex API directly from a browser extension posed CORS limitations, making it more complex than I initially anticipated.
Pivoting to a React Component
After running into these roadblocks, I realized that the best approach would be to integrate directly into the developer’s existing workflow—right in the dev environment. Instead of a browser-based solution, I decided to build ConvexPanel as a React component, making it easy to embed with any Convex project.
This approach had several advantages:
- Direct API Integration: No need to deal with CORS restrictions or browser security policies.
- Better Authentication Handling: Credentials could be managed securely within the dev environment by accessing .env files.
- Seamless Dev Experience: No more switching between browser tabs—just open the panel in your editor by clicking the convex icon!
How Convex Panel Works
At its core, Convex Panel taps into the same Convex APIs that power the dashboard. By leveraging modern practices, it allows you to interact with your Convex backend without ever leaving your dev environment.
Quick Start Code Snippet
Install the package via npm:
npm install convex-panel
Then you can easily integrate this into your project
import React from "react";
import ReactDOM from "react-dom/client";
import App from "./App";
import "./index.css";
import { ConvexProvider, ConvexReactClient } from "convex/react";
import { ConvexPanel } from 'convex-panel';

const convex = new ConvexReactClient(import.meta.env.VITE_CONVEX_URL as string);

ReactDOM.createRoot(document.getElementById("root")!).render(
  <React.StrictMode>
    <ConvexProvider client={convex}>
      <App />
      <ConvexPanel
        accessToken="YOUR_ACCESS_TOKEN"
        deployKey={process.env.CONVEX_DEPLOYMENT}
        convex={convex}
      />
    </ConvexProvider>
  </React.StrictMode>,
);
You can easily get your access token from your convex config file:
cat ~/.convex/config.json
This will give you a response similar to this:
{
  "accessToken": "eyJ2BeI6A....."
}%
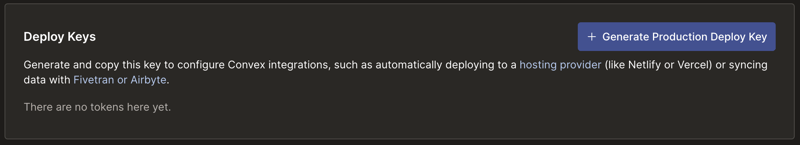
Your deploy key can be created directly in your dashboard
Displayed Logs
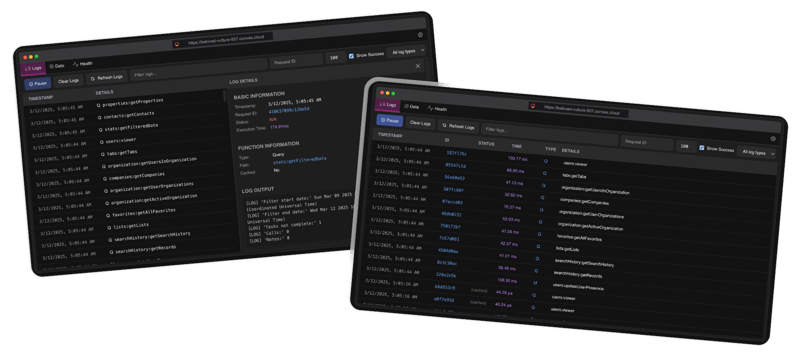
The logs displayed show information needed for any application:
Timestamp: Each log entry is tied to a specific time, allowing you to track when each request was made.
Function Calls: The logs display calls to functions: Queries, Mutations, Actions, etc., helping to monitor backend operations.
Performance Metrics: Each request includes an execution time (in milliseconds or microseconds), which is useful for debugging performance issues.
Filtering & Debugging Tools: The UI provides filters for log types, success statuses, and request IDs, making it easier to find relevant logs.
Detailed Log Output: The expanded log view reveals function details, execution times, and logs related to filters, calls, and tasks, which can assist in diagnosing errors or understanding data flow.
All of this kind of logging is essential for real-time debugging, performance monitoring, and troubleshooting any interaction directly from your development environment.
Table View
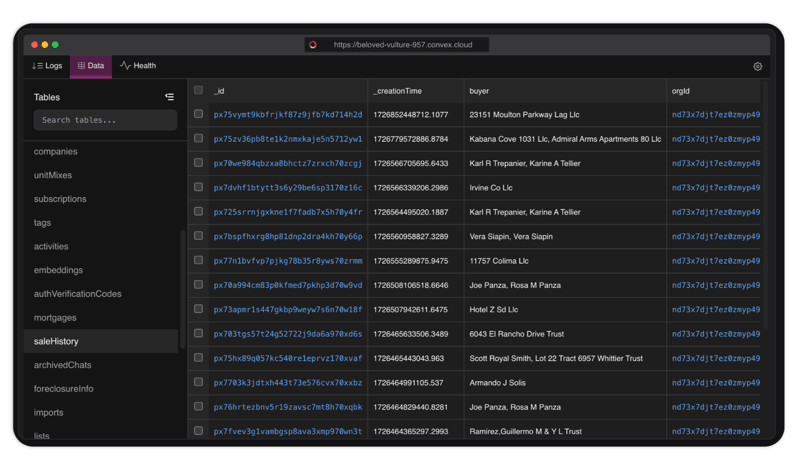
- Edit Table Cells: Easily update data directly within the table.
- Browse All Tables: View a complete list of your tables in the left-hand panel.
- Filter Tables & Columns: Quickly find relevant data by filtering tables and individual columns.
This streamlined experience makes it easy to manage and inspect your Convex data.
Health View
- Data Analysis: Performance metrics for cache hit rates and failure rates in graphs
- Scheduler Lag: A quick scheduler status and lag time metrics shown in a graph.
- Convex Version: An indication of your current Convex version and an update button if your convex is out of date.
Under the Hood
Convex Panel is built with simplicity and efficiency in mind:
Code Practice: The tool leverages modern Typescript practices to keep the codebase clean, modular, and easy to extend.
Direct API Integration: By tapping directly into Convex’s APIs, it ensures that the data you see is always in sync with your backend.
Standard Styling: Instead of using Tailwind, this project uses regular CSS Styling.
Conclusion
The ambition to build this component was born out of a personal need to reduce wasted time and improve efficiency and development. If you're like me and are always juggling too many browser tabs, even when amazing tools like Convex dashboard and Convex CLI are available, convex panel might just help you too!
Try it out, contribute, or provide feedback!

Top comments (0)