
Background
With the rise of language models for generating images from text, SolidUI aims to help people quickly build visualization tools, including 2D, 3D, and 3D scenes, for rapid construction of three-dimensional data demonstration scenes. SolidUI is an innovative project that aims to combine natural language processing (NLP) with computer graphics to realize the function of generating graphics from text. By building its own language model for generating graphics from text, SolidUI uses the RLHF (Reinforcement Learning Human Feedback) process to realize the process from text description to graphics generation.
Project URL: https://github.com/CloudOrc/SolidUI
Project mirror URL: https://gitee.com/CloudOrc/SolidUI
Community official website: https://website.solidui.top
Join the group: https://discord.com/invite/brKfUUXg
Chat Window
One of the three main modules in SolidUI, the Model Agent, supports a variety of model APIs (ChatGLM, GPT3.5, GPT4, etc.). The Model Agent can dynamically add various models. The chat window interacts with the Model Agent, generating any graphics with a single sentence for display.
Prompt Words
- The principle of prompt words is referred to in the collection of prompt words on the SolidUI public account.
- The input data can be manually input or automatically generated, combined with text prompt words.
Chat Window Generation
Input data format for bar chart
\[{"x":"A","y":5},{"x":"B","y":8},{"x":"C","y":12},{"x":"D","y":6},{"x":"E","y":15},{"x":"F","y":10}\] Generate a bar chart

Surface Graph
Prompt 1
Generate a simple 3D surface graph.

Prompt 2
Generate a 3D surface graph, where x and y are a grid of 100 points from -5 to 5, and z is the sine of (x^2 + y^2)^(1/2). Use the 'viridis' color map and display the graph.

Prompt 3
Create a 3D surface graph, where x and y range from -5 to 5, and z is the corresponding sine of (x^2 + y^2)^(1/2). Set the graph's color map to 'viridis', and set specific size and margins, finally display the graph.

Prompt 4
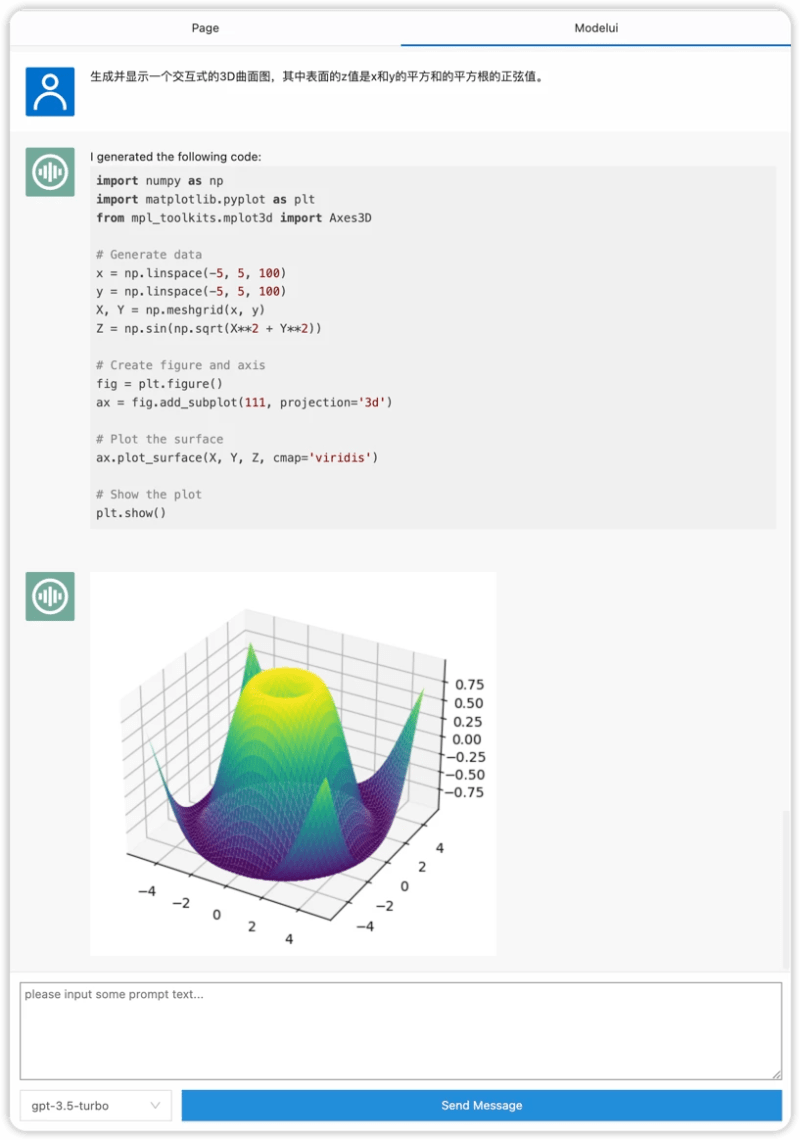
Generate and display an interactive 3D surface graph, where the z value of the surface is the sine of the square root of the sum of x and y's squares.
Scatter Plot
Prompt 1
Generate a 3D scatter plot, where x, y, and z coordinates are 100 points randomly generated from a standard normal distribution.

Prompt 2
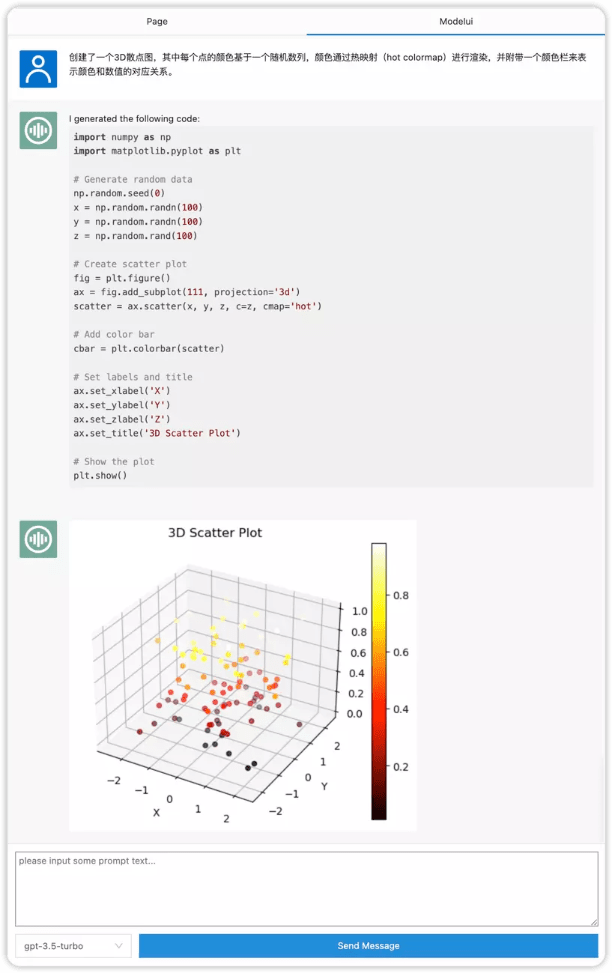
A 3D scatter plot has been created, where each point's color is based on a random series, colors are rendered through a hot colormap, and a color bar is attached to represent the correspondence between colors and values.
Prompt 3
A 3D scatter plot was generated with 200 points of size 6, where the coordinates of each point are based on a trivariate normal distribution.

Spiral Line
Prompt 1
Draw a spiral line in a 3D graph.

Pie Chart
Prompt 1
A pie chart is represented in five colors (gold, yellow-green, light coral, light sky blue, purple), where the sizes of the portions are 215, 130, 245, 210, 300 respectively, labeled as 'A', 'B', 'C', 'D', 'E', and the percentage of each portion is displayed in the corresponding area. The starting angle is 140 degrees.

Bunny Modeling
Prompt 1
Download the Stanford Bunny model from "https://graphics.stanford.edu/~mdfisher/Data/Meshes/bunny.obj" and use the trimesh library to load and display this model.

https://faculty.cc.gatech.edu/~turk/bunny/bunny.html
Map
Prompt 1
Create a map, download link


Design Page
Page Layout
Manage the layout of generated graphics, divided by scenes and pages.
Preview
Click on the project preview or Design Page -> Scene -> Page preview

Future Plans of SolidUI Community
For this situation, the SolidUI community has clear future plans. First, the community will focus on the development of the chat framework to better serve users. Secondly, the community will develop model agent APIs to better integrate various artificial intelligence models. Finally, the community will continue to research visualization models to convert text descriptions into graphics.
This is what SolidUI always says in every weekly meeting, that its business boundaries only focus on these three areas.
Overall, whether facing market difficulties or technical challenges, the SolidUI community has shown a firm determination and clear planning. We look forward to the SolidUI community bringing more innovation and value to users in future development.
How to Become a Contributor
- Official document contribution. Discovering deficiencies in documents, optimizing documents, continuously updating documents, etc. to participate in community contributions. Through document contribution, developers can familiarize themselves with how to submit PRs and truly participate in community construction. Reference strategy: https://github.com/CloudOrc/SolidUI/discussions/54
- Code contribution. We have sorted out simple and easy-to-start tasks in the community, which are very suitable for newcomers to contribute to the code. Please check the newbie task list: https://github.com/CloudOrc/SolidUI/issues/12
- Content contribution: Publish content related to SolidUI open source components, including but not limited to installation and deployment tutorials, usage experience, case practice, etc., in any form, please submit to the little helper. For example: https://github.com/CloudOrc/SolidUI/issues/10
- Community Q&A: Actively answer questions in the community, share technology, help developers solve problems, etc.;
- Others: Actively participate in community activities, become community volunteers, help community publicity, provide effective suggestions for community development, etc.;

Top comments (0)