
Danfo.js
An open-source, JavaScript library providing high-performance, intuitive, and easy-to-use data structures for
manipulating and processing structured data. It is heavily inspired by the Python's Pandas
library and provides a similar interface and API. Moreover, Danfo.js is fast and It is built on
Tensorflow.js and supports tensors out of the box.
Data science thrives in Python because of the ecosystem of open-source libraries - NumPy, Pandas, sklearn, and more.
It's great to see similar tools being developed by the JavaScript community. This could be the start of something big.
So let us see Danfo.js in action.
Installation
There are two ways to get danfo.js. To install it via npm, you can do the following:
We can also install and use it in the browsers by using the CDN below:
<script src="https://cdn.jsdelivr.net/npm/danfojs@0.1.1/dist/index.min.js"></script>
Creating a Series object by passing a list of values, letting danfo.js create a default integer index:
const dfd = require("danfojs-node")
s = new dfd.Series([1, 3, 5, undefined, 6, 8])
s.print()
|
0 |
| 0 |
1 |
| 1 |
3 |
| 2 |
5 |
| 3 |
NaN |
| 4 |
6 |
| 5 |
8 |
Reading JSON data and vector operations
const json_data = [{ A: 0.4612, B: 4.28283, C: -1.509, D: -1.1352 },
{ A: 0.5112, B: -0.22863, C: -3.39059, D: 1.1632 },
{ A: 0.6911, B: -0.82863, C: -1.5059, D: 2.1352 },
{ A: 0.4692, B: -1.28863, C: 4.5059, D: 4.1632 }]
df = new dfd.DataFrame(json_data)
// Adding to series object, can use sub, mul, div, and pow
df['A'].add(df['B']).print()
df['A'].pow(2).print()
// Maximum value of C
console.log(df['C'].max()) // 4.505899
Add A and B
|
A |
| 0 |
4.744029998779297 |
| 1 |
0.2825700044631958 |
| 2 |
-0.13752996921539307 |
| 3 |
-0.8194299936294556 |
A Square
|
A |
| 0 |
0.21270543336868286 |
| 1 |
0.2613254487514496 |
| 2 |
0.4776192009449005 |
| 3 |
0.22014862298965454 |
Reading CSV file from URL
dfd.read_csv("https://raw.githubusercontent.com/curran/data/gh-pages/jsLibraries/jsLibs.csv")
.then(df => {

//prints the first five columns
df.head().print()

}).catch(err => {
console.log(err);
})
|
Library |
Minified File Size (kb) |
Github Stars |
| 0 |
Knockout.js |
17 |
5036 |
| 1 |
Angular.js |
106 |
24580 |
| 2 |
Ember.js |
71 |
10368 |
| 3 |
Can.js |
82 |
928 |
| 4 |
React.js |
123 |
7015 |
Calculate descriptive statistics for all numerical columns
|
Minified File Size (kb) |
Github Stars |
| count |
7 |
7 |
| mean |
58.071426 |
9464.286133 |
| std |
49.75978 |
9038.434833 |
| min |
1 |
156 |
| median |
71 |
7015 |
| max |
123 |
24580 |
| variance |
2476.035714 |
81693304.23 |
The shape of the data, column names, and dtypes
console.log(df.shape);

console.log(df.column_names);

df.ctypes.print()
[ 7, 3 ]
[ 'Library', 'Minified File Size (kb)', 'Github Stars' ]
|
0 |
| Library |
string |
| Minified File Size (kb) |
float32 |
| Github Stars |
int32 |
dfd.read_csv("https://raw.githubusercontent.com/curran/data/gh-pages/jsLibraries/jsLibs.csv")
.then(df => {
df['Library'].print()
}).catch(err => {
console.log(err);
})
|
Library |
| 0 |
Knockout.js |
| 1 |
Angular.js |
| 2 |
Ember.js |
| 3 |
Can.js |
|
4 |
React.js |
| 5 |
Backbone.js |
| 6 |
Model.js |
Selecting on a multi-axis by label, by slicing, and by query
dfd.read_csv("https://raw.githubusercontent.com/curran/data/gh-pages/jsLibraries/jsLibs.csv")
.then(df => {
// Selection by label
const sub_df = df.loc({ rows: [0, 1], columns: ["Library", "Github Stars"] })
sub_df.print()

// Selection by slicing
const slice_df = df.loc({ rows: ["0:4"], columns: ["Library", "Github Stars"] })
slice_df.print()

// Selection by query
const query_df = df.query({ "column": "Github Stars", "is": ">", "to": 10000 })
query_df.print()
}).catch(err => {
console.log(err);
})
Selection By Multi-Axis Label
|
Library |
Github Stars |
| 0 |
Knockout.js |
5036 |
| 1 |
Angular.js |
24580 |
Selection By Slicing
|
Library |
Github Stars |
| 0 |
Knockout.js |
5036 |
| 1 |
Angular.js |
24580 |
| 2 |
Ember.js |
10368 |
| 3 |
Can.js |
928 |
Selection By Query
|
Library |
Minified File Size (kb) |
Github Stars |
| 1 |
Angular.js |
106 |
24580 |
| 2 |
Ember.js |
71 |
10368 |
| 5 |
Backbone.js |
6.5 |
18167 |
There are many mathematical operations we can perform over the dataframe object.
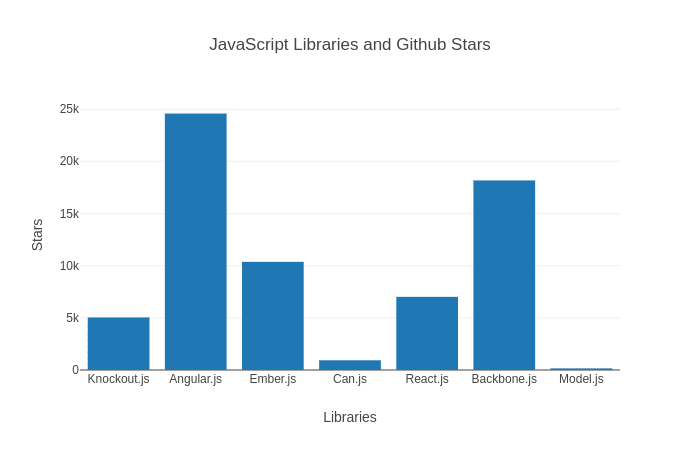
Danfo supports plotting
Danfo uses Plotly.js as backend for plotting. This gives us the ability to make interactive plots from DataFrame and Series. Plotting only works in the browser version of danfo.js, and requires an HTML div to show plots.
<!DOCTYPE html>
<html lang="en">

<head>
<meta charset="UTF-8">
<meta name="viewport" content="width=device-width, initial-scale=1.0">
<!--danfojs CDN -->
<script src="https://cdn.jsdelivr.net/npm/danfojs@0.1.1/dist/index.min.js"></script>
<title>Document</title>
</head>

<body>

<div id="plot_div"></div>
<script>

dfd.read_csv("https://raw.githubusercontent.com/curran/data/gh-pages/jsLibraries/jsLibs.csv")
.then(df => {

var layout = {
title: 'JavaScript Libraries and Github Stars',
xaxis: {
title: 'Libraries',
},
yaxis: {
title: 'Stars',
}
}

new_df = df.set_index({ key: "Library" })
new_df.plot("plot_div").bar({ columns: ["Github Stars"], layout: layout })

}).catch(err => {
console.log(err);
})

</script>
</body>

</html>


Oldest comments (1)
Great Thank you