Remember when I shared the story of building a lightweight Camunda monitoring tool because enterprise APM solutions were overkill?
Version 2.0 just landed. And it's not just an update—it's an evolution.
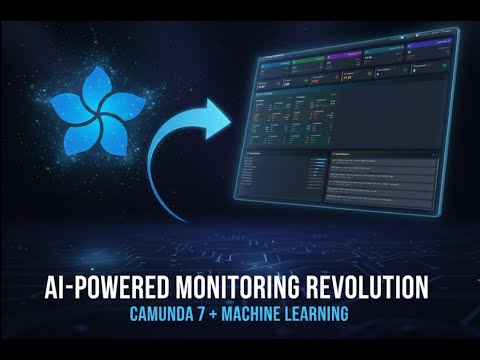
🎥 See It In Action
🚀 What's New in v2.0
1. Incident Intelligence Center
The headline feature. A comprehensive command center that adapts to your Camunda configuration—whether you're running with full history logging or runtime-only mode.
What it gives you:
- Active Incidents Dashboard - Real-time tracking with severity scoring and root cause classification
- Recurring Issues Detection - Flags patterns that keep coming back with historical occurrence rates
- Historical Pattern Analysis - Groups incidents by root cause across all processes
- AI Recommendations - Prioritized action items with specific remediation steps
The game-changer? Every incident is clickable, revealing comprehensive diagnostic modals with error messages, business keys, instance IDs, and timeline data. Everything you need to move from detection to resolution in seconds.
2. Weekly Load Patterns
Capacity planning transformed from guesswork into data-driven strategy.
- Daily Distribution Analysis - See exactly where capacity is needed (e.g., Friday = 69% of weekly traffic)
- Hourly Heatmap - Color-coded visualization of every hour of every day
- Peak Hours Identification - System automatically finds your busiest time slots
- Scheduling Recommendations - AI suggests optimal windows for batch jobs and maintenance
This is the feature I wish I had when planning our infrastructure scaling last year.
3. Enhanced ML Analytics
Building on the existing anomaly detection, v2.0 adds:
- Stuck Activities Smart Detection - Statistical analysis finds tasks that are technically running but practically frozen
- Capacity Forecasting - ML predictions for the next 30 days
- Activity Bottleneck ROI - Calculates exact time savings from optimizing specific service tasks
- Version Performance Tracking - Instantly detect regressions between deployments
4. Process Categorization
New automatic categorization system groups your processes by execution speed:
- Ultra Fast (<5s)
- Very Fast (5-30s)
- Fast Background (<6min)
- Standard (6-30min)
- Extended (30min-4h)
- Long Running (4-24h)
- Batch/Manual (>24h)
Click into any category to see exactly which processes belong there. Perfect for architectural planning.
🎯 Why This Matters
In v1.0, I focused on solving the "what's happening right now" problem. You could see cluster health, JVM metrics, and basic process execution data.
v2.0 answers the harder questions:
- ❓ Why are incidents recurring?
- ❓ Which optimizations will save the most time?
- ❓ When should we schedule maintenance?
- ❓ Is our latest deployment performing worse?
- ❓ Which processes are at risk of failing?
🏗️ Still Lightweight, Still Simple
Despite adding AI/ML capabilities, the core philosophy remains:
- No build steps - Clone and run
- <500KB footprint - Excluding Python deps
- <100MB memory - Runs on a t2.micro
- 5-minute setup - No configuration hell
The "heavyweight monitoring for lightweight needs" problem hasn't changed. My solution stays lean.
🌍 Ecosystem Compatibility
v2.0 maintains zero-configuration compatibility (and was successfully tested) with:
- Camunda 7 (all versions)
- Operaton
- CIB Seven
- Eximee BPMS
Your platform evolves, your monitoring layer stays stable.
🎓 What I Learned Building This
1. Start with Real Pain
The best features come from solving actual production problems.
2. AI Doesn't Mean Complex
You don't need TensorFlow to add intelligence. Statistical analysis + smart categorization + clear recommendations often beats black-box heavy ML.
3. Simple Architecture Enables Community
Keeping the codebase straightforward (Flask + Alpine.js) has led to more contributions than expected. Lower barrier = more engagement.
4. Open Source First, Enterprise Second
Building features in the open-source version first ensures they solve real problems before commercializing advanced versions.
💬 Let's Talk, don't be shy!
What monitoring challenges are you facing with Camunda?
I'm particularly curious about:
- What metrics do you wish you could see?
- How do you currently handle incident analysis?
- What would make this indispensable for your team?
Drop a comment below—I read and respond to every one.
🔗 Links
- 📹 Video Demo: YouTube
- 💻 GitHub: camunda-health-monitor
- 🐳 Docker Hub: champabpmn/camunda-health-monitor
- 🏢 LinkedIn: Champa Intelligence
- 🌐 Website: champa-bpmn.com
 bibacrm
/
camunda-health-monitor
Lightweight monitoring dashboard for Camunda 7 clusters with real-time metrics, JVM health tracking, and database analytics. Built with Flask, Alpine.js, and Tailwind CSS.
Camunda Health Monitor & Advanced AI/ML Analytics
A lightweight, real-time monitoring dashboard for Camunda 7 based BPM Platform clusters. Monitor your process engines, track performance metrics, and gain insights into your workflow automation with a modern, responsive interface.
✅ Verified Compatible With:
🎥 Video Demo
Watch the feature demonstration on YouTube:
📸 Screenshots
Full Dashboard View
 Real-time cluster monitoring with comprehensive metrics
 AI/ML Analysis Health & Performance Tab
 AI/ML Analysis Issues & Alerts Tab
Light Theme
 Clean, professional light mode interface
Node Status Monitoring
 Immediate visual feedback when nodes become unavailable
Quick Start with Docker
https://hub.docker.com/r/champabpmn/camunda-health-monitor
- Create a
.envfile with your configuration (example for Camunda 2 nodes cluster):
# Database Configuration (PostgreSQL)
DB_NAME=PUT_YOUR_CAMUNDA_DB_NAME_HERE
DB_USER=PUT_YOUR_CAMUNDA_DB_USERNAME_HERE
DB_PASSWORD=PUT_YOUR_CAMUNDA_DB_PASS_HERE
DB_HOST=PUT_YOUR_CAMUNDA_DB_HOSTNAME_OR_IP_ADDRESS_HERE
DB_PORT=5432
# Camunda Node 1 (Required)
CAMUNDA_NODE_1_NAME=node1
CAMUNDA_NODE_1_URL=http://PUT_YOUR_CAMUNDA_BPM_1_NODE_HOST_HERE/engine-rest

# Camunda Node 2 (Optional)
CAMUNDA_NODE_2_NAME=node2
CAMUNDA_NODE_2_URL=http://PUT_YOUR_CAMUNDA_BPM_2_NODE_HOST_HERE/engine-rest

# Camunda Node 3 (Optional)
#…⭐ Star the repo if you find it useful!
🔔 Follow Champa Intelligence for updates
💬 Share your monitoring war stories in the comments
Building better monitoring tools, one incident at a time.


Top comments (1)
👋 Author here!
Really curious to hear from the community:
I'll be hanging around to answer questions and discuss ideas!