
If you've ever written a TestCafe test, you may be familiar with the following errors:
- Cannot obtain information about the node because the specified selector does not match any node in the DOM tree.
- The specified selector does not match any element in the DOM tree.
- The element that matches the specified selector is not visible.
The first two errors are self-explanatory. The last error, however, can easily be misinterpreted. This error frequently occurs if multiple elements match the same selector. The first matching element may be hidden, while the required element is visible.
What should you do next? How do you update the selector so that it produces expected results? What should you do if the test previously passed, but it now fails?
First, check the application to ensure that the test didn't fail due to a bug. If the app runs as expected, then you can begin debugging the test.
Client-side Debugging
TestCafe uses CSS selectors to identify page elements. To see if a selector matches an element, pause test execution in the browser and debug the test.
To stop the test, you can use the --debug-on-fail CLI flag or the t.debug() test action. The difference between these approaches is summarized below:
t.debug() |
--debug-on-fail |
|---|---|
| Allows you to define the moment when the test stops. | Suspends the test only if it fails. |
| You only need to modify the test code to use it. | Requires that you edit the test run command (which may take longer than the t.debug() action). |
Let's look at a test from the TestCafe Getting Started topic. Assume the Submit button's selector changed and the test failed:
import { Selector } from 'testcafe';

fixture `Getting Started`
    .page `http://devexpress.github.io/testcafe/example`;

test('My first test', async t => {
    await t
        .typeText('#developer-name', 'John Smith')
        .click('#submit-button-invalid')

        // Use the assertion to check if the actual header text is equal to the expected one
        .expect(Selector('#article-header').innerText).eql('Thank you, John Smith!');
});
The test now throws the following error when we run it:

Insert t.debug() before the line that fails:
await t
    .typeText('#developer-name', 'John Smith')
    .debug()
    .click('#submit-button-invalid');
The test pauses before the button click. You can now use browser utilities to see if any elements match the selector.
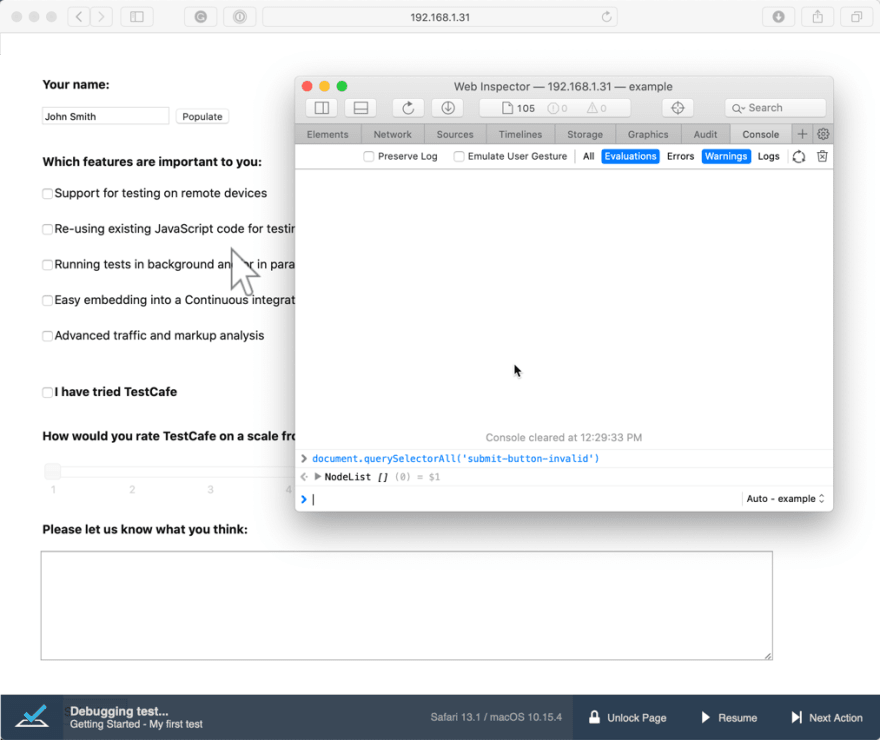
Since document.querySelectorAll returns an empty list, you can see that there is no such element on the page, but the Submit button is visible. Use the Inspect command to see how this button is rendered in markup:

The browser's development tools pane shows that the button's ID is submit-button.
Note. You can use Chrome Dev Tools' shortcuts (
$and$$) to query selectors. However, if your website uses jQuery, the$shortcut is overridden. TestCafe searches for elements withdocument.querySelectorAll, which behaves in a slightly different way than jQuery. Please keep this in mind.
To use an element inside an iframe, switch the browsing context with t.switchToIframe before the action.
Hint. Google Chrome lets you pause complex animations that your website might play when elements appear. To stop JavaScript execution, press
F8when the Sources tab is open.
Debugging Client Functions
Another client-side debugging trick in TestCafe allows you to execute code within the browser to obtain client-side data or identify page elements.
const getStoredValue = ClientFunction(key => {
    return window.localStorage.getItem(key);
});

const getCell = Selector((table, row, column) => {
    return table.querySelectorAll('tr')[row].querySelectorAll('td')[column];
});
To debug this code, add the debugger statement. The browser will stop the script and open developer tools.
const getStoredValue = ClientFunction(key => {
    debugger;
    return window.localStorage.getItem(key);
});

const getCell = Selector((table, row, column) => {
    debugger;
    return table.querySelectorAll('tr')[row].querySelectorAll('td')[column];
});
Server-side Debugging
Test flow can be complicated if it includes data preparation, HTTP requests or database access. You can use Node.js to debug this code, along with Visual Studio Code, WebStorm, or Chrome Developer Tools. See the Recipes for details.
Note that it is easier to use client-side debugging to execute chained actions step by step. The server treats the entire chain as a single action, so you must divide it into separate actions to debug.
Stay Tuned for More Information on Test Debugging
As explained in this blog post, TestCafe and modern browsers offer all the tools necessary to debug your application or test. Note, however, that tools do not always locate errors quickly and easily. We've often spent more time debugging than desired. In our next blog post, I'll share a few techniques that may save time when you debug a test.
If you have any questions or want to share your test debugging story – write to us directly at testcafeteam@devexpress.com.

Top comments (0)