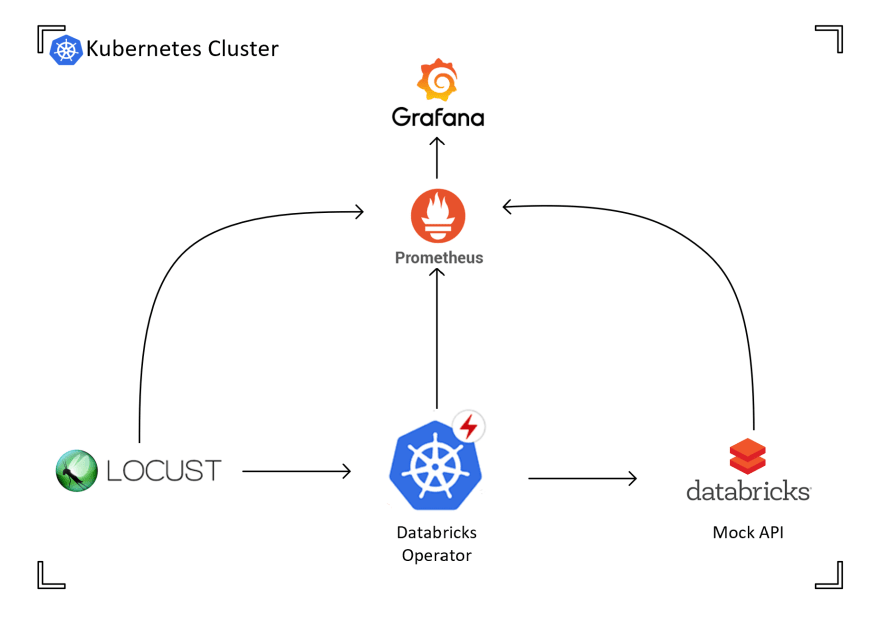
This blog will provide an high level overview of the methodology we're using when load testing, using the Databricks Operator as an example.
The operator allows applications hosted in Kubernetes to launch and use Databricks data engineering and machine learning tasks through Kubernetes.
The environment
In the above simplified architecture diagram we can see:
- Locust, the load testing framework we're using for running the test scenarios
- Databricks Operator, the service under test
- Databricks mock API, a mock API created to simulate the real Databricks for these load tests
- Prometheus, gathers metrics on the above services throughout the test
- Grafana, displays metrics gathered by Prometheus
The methodology
The steps for this load testing methodology consists of:
- Define scenarios
- Run a load tests based on a scenario
- Create a hypothesis if unhappy with the results
- Re-run load tests with the changes from the hypothesis
- Go to step 3
- Repeat until all scenarios are covered
Defining scenarios
To begin the load tests, we first need to define test scenarios we wish to consider and the performance level we would like to achieve. These scenarios are the basis for the tests below.
Here are examples of test scenarios used for the operator load testing:
Test Scenario 1:
1. Create a Run with cluster information supplied (referred to as Runs Submit)
2. Await the Run terminating
3. Delete the Run once complete regardless of status
Notes:
- This scenario is designed to test throughput of the operator under load.
- By deleting the Run after it has complete we ensure we keep the K8s platform as clean as possible for a baseline performance.

Test Scenario 2:
1. Create a Run with cluster information supplied (referred to as Runs Submit)
2. Await the Run terminating
3. DO NOT delete the Run object
Notes
- This scenario is designed to test potential impact of the Operator if the Run objects are not cleaned up.
- The operator should still be performant, even when there are a potentially large number of objects to manage
- This test will also help us understand the acceptable stress limit of the system
Running a scenario
To run a scenario, we'll start by making the load test environment as static as we can to control as many variables as possible between runs. For the operator we achieved this by using automated deployment scripts, code freezes and documenting the images used for each load test. Here's a snippet of the deployment script using specific image tags:
# The following variables control the versions of components that will be deployed
MOCK_TAG=latest-20200117.3
OPERATOR_TAG=insomnia-without-port-exhaust-20200106.2
LOCUST_TAG=latest-20200110.7
LOCUST_FILE=behaviours/scenario2_run_submit.py
Baseline
We document the state of environment before load tests, as seen below. Then proceed with a baseline run, which is the first load test run in a scenario.
Setup
Components
MOCK_TAG=latest-20191219.3
OPERATOR_TAG=metrics-labels or baseline-20191219.1 #See note on Run 1
LOCUST_TAG=latest-20191219.1

Locust
Users: 25
Time under load: 25mins
Spawn rate: 0.03 (1 every 30 secs)
After the run is done, we document what has happened, for example: the state of Grafana graphs, tests we've run if an issue was highlighted, key points discovered.
From the above metrics we discovered these key points:
Run summary
- Run completion time increasing, which is a static value set at 6 seconds, indicating there is a issue with handling the load somewhere
- Requests to the MockAPI are decreasing and are in a spaced out pattern
Hypothesis
Based on the summary we hypothesized the problem is with the operator. The MockAPI is receiving fewer requests as the load increases, meaning the operator is struggling to process the amount of requests.
This lead into an investigation into the operator, where we saw the time.sleep operation is in use. Based on this discovery, we created a fork of the operator and replaced the usage of time.sleep.
The fix for time.sleep can be found here:
 Remove time.Sleep from run controller delete
#141
After investigating #140 we found a time.Sleep call for 15 seconds in the run controller when deleting a run.
The original flow was to cancel the run, sleep for 15 seconds and then delete the run.
This PR modifies the behaviour: if the run is not in a terminal state then call cancel and requeue for 5s time, if the run is in a terminal state then call delete. For runs that are already terminated this removes the wait completely and proceeds with deletiong. For an active run that takes 6s to cancel the flow will be
- 1st time: get state (running), call cancel and requeue fo 5s time
- 2nd time (after 5s): get state (not yet cancelled), call cancel and requeue fo 5s time
- 3rd time (after 10s): get state (now cancelled) and call delete
With this change in place the load test now runs smoothly for 10 mins (until a different issue occurs that we will address in a future PR). The following graph shows the work queue depth remaining stabe and low:
Testing the hypothesis
We then tested this hypothesis by running a new load test and repeating the steps above. The only difference between this load test and the baseline is the image of the operator fork.
With the fix, we can see below that the issues highlighted above have been solved, but has also revealed another issue of requests failing to be sent from the operator.

Repeat
To continue the cycle we'd create another hypothesis and then based on that hypothesis another load test. This would be repeated until we've reached the performance levels we've deemed acceptable when creating the scenario.
Then reassess the scenarios and repeat this for each scenario.
Conclusion
Thanks to the methodology's rigorousness, it's been very easy to provide evidence for the reasons we need to make the changes and to see the progression from the baseline to the end result.


Top comments (0)