
Task management, and on a broader scope, project management, are organizational processes that companies use to manage the lifecycle of work that needs to be done to accomplish a goal. As you've probably experienced in your own busy workplace, teams are being challenged with larger task loads, more meetings, competing priorities, and less time to get it all done, causing unprecedented stress and strain on employees, or individual contributors (ICs), managers, and senior leaders alike.
Though this problem is not a new one: task lists are inevitably always going to be longer than the amount of time you have available, but how can organizations better prioritize realistic weekly work plans that don't burn their employees out?
This Task Management Trends Report surveyed over 2,000 professionals to analyze how managers and team members are prioritizing and defending their time for focused work across their increasingly busy workweeks, using project management platforms Jira, Asana, Todoist, Trello and ClickUp. We found that only 12.4% of individual contributors are able to dedicate more than 6 hours a day to their actual task work, and only 53.3% of time working on tasks is actually spent on productive work. Managers themselves are struggling to make this a reality for their direct reports, and rank their ability at only 5.3 on a 1-10 scale for being able to minimize distractions and interruptions for their team. The average manager also reported wanting to defend an additional 9.4 hours for each team member every week for task work, freeing them up from distracting meetings and non-priority commitments.
Report summary
Task management statistics for individual contributors
Task management statistics for managers
Productivity statistics for managers
Workplace stress statistics
Individual contributor statistics across project management platforms
Manager statistics across project management platforms
Reclaim ROI statistics
Task management statistics for individual contributors
Individual contributors (ICs) -- sometimes referred to as "makers" -- are team members without management responsibilities, and they tend to be the people within the organization who are doing hands-on work towards the company's goals. While managers can and do still perform a lot of hands-on work, this really refers to anyone in a position where they don't have direct people or project management responsibilities. It includes roles like engineers, marketers, support technicians, accountants, and so on.
As mentioned above, the problem ICs are struggling with today is that they're facing impossible workloads with nowhere near the amount of time they need to accomplish what's being asked of them. This on top of the fact that they're battling a constant stream of distractions and competing priorities, making it extremely difficult to be productive throughout the day. Let's take a look at how ICs are managing their tasks and productivity according to their own responses:
Planning statistics for independent contributors
- Only 53.5% of planned tasks get completed by ICs every week.
- Only 16.8% of teams accomplish more than 70% of their planned tasks every week.
- 31.1% of teams accomplish less than 40% of their weekly planned tasks.
Productivity statistics for independent contributors
- ICs average 4.2 hours/day on task work, only 21.0 hours per week.
- Only 12.4% of ICs average more than 6 hours of task work a day, and 40.3% of ICs average more than 4 hours of task work a day.
- Only* 53.3% of task time is spent by ICs on productive, focused work*.
- 11.6% of ICs report spending more than 70% of their task time on productive, focused work.
- ICs average* 2.24 hours of actual productive task work a day*, or 11.19 hours a week.
- ICs average 1.96 hours of unproductive task work every day (answering emails, hopping around Slack, browsing task lists), or 9.8 hours/week.
- ICs waste an average of 24.5% of their standard 40-hour workweek on unproductive task work like answering emails, hopping around Slack, or browsing their task lists.
Time defense statistics for independent contributors
- ICs want to defend an additional 8.3 hours/week to work so that they can keep up with their required task work and meet their team goals, which would require them reclaiming 20.9% of their workweek.
- On average, ICs are interrupted 31.6 times/day, pulling them out of their focused work.
These stats outline a major problem for individual contributors, since they're the lifeblood of the organization and are primarily responsible for building, supporting, and selling the products and services of the company. Since the 69.7% increase in meetings that resulted from the pandemic, ICs are now only able to spend 21 hours a week on their actual productive work, which means almost half of their workweeks are being misallocated toward time not spent producing. Given that barely half of the planned tasks expected of these employees are actually able to be accomplished, managers and the organizations are desperate to find ways to unblock individual contributors from unproductive meetings and non-priority items stealing their time.
Task management statistics for managers
Managers are the team members responsible for managing people or projects within an organization, and they too are feeling the struggle between lack of time and overwhelming task loads to manage across their team.
Additionally, managers are keenly aware of the distractions that are plaguing their direct reports. Outside of the unnecessary meetings that tend to pile up on the calendar, managers are also trying to help the ICs they manage defend focus time for task work on the calendar, and prevent interruptions that pull their attention away to low-value tasks like Slack, email, or bouncing around a scattered task list. Here's a look at how managers are planning out task work across their team:
Planning statistics for managers
- 52.6% of planned tasks are completed by the team as reported by managers, on average, within a sprint.
- Only 13.1% of teams accomplish more than 70% of their planned tasks every week.
- The average manager spends 5 hours/week assigning, prioritizing, and reprioritizing work for their team, or 12.4% of their workweek.
- 20.4% of managers spend more than 8 hours/week assigning, prioritizing, and reprioritizing tasks for their team, and 15.8% spend more than 14 hours/week.
- 17.4% of managers spend less than 4 hours/week assigning, prioritizing, and reprioritizing tasks for their team, on average.
Time defense statistics for managers
- Managers want to defend an additional 9.4 hours/week for each of their team members to work on tasks, on average, to help meet their team's goals.
- On average, managers want their team members to reallocate 23.6% of their time otherwise spent towards tasks every week.
- 16.2% of managers want to free up 20 or more additional hours of task work per week for each member of their team.
- On a scale of 1-10, the average manager ranks their own ability to defend their team from interruptions and distractions at only 5.3.
- Only 12.5% of managers rank their ability above a 7 (on a 1-10 scale) to defend their team from interruptions and distractions.
Managers reported wanting to defend an additional 9.4 hours every week for each of their individual direct reports, or almost a quarter of their workweeks. This shift would have the potential to help teams accomplish up to 23.9% more every week, since the reported average of 21 hours per week on task work would increase to 30 hours per week, even if only 53.5% of those tasks were completed.
Productivity statistics for managers
Outside of the time managers spend meeting with their direct reports, they also have to find time to get their own work done. This is innately more difficult for managers because their primary responsibility is controlling and supporting the work of their direct reports, or projects, which comprises a significant portion of their workweek. Here's a look at how managers are allocating their own time across tasks and management every week:
- The average manager spends 3.6 hours/day on their own task work, or 18.2 hours a week.
- Only 26.9% of managers average more than 4 hours/day on their own task work, and 9% average more than 6 hours/day.
- On average, 50.2% of managers' task time is spent on productive, focused work.
- Only 10.9% of managers are productive in more than 70% of their task time, on average.
- The average manager spends 1.83 hours/day on productive task work, or 9.2 hours a week.
- On average, managers waste 1.82 hours/day on unproductive task work like checking emails, Slack, or sifting through their task list.
As expected, managers are spending less than half of their workweek on their own actual task work, with only 9% of all managers spending more than 6 hours a day working on tasks. This is not surprising as our productivity trends report on meetings found that busy professionals average 39.3 meetings a week, rising 37.9% since the start of the pandemic. Managers also reported only 50.2% of their task time is actually spent productively, compared to 53.3% reported by employees.
Workplace stress statistics
Next, we look at whether employees, managers and senior leaders are experiencing stress due to the increasing task load. Additionally, with 36% of workers planning to look for a new job in the next 12 months due to The Great Resignation, what impact does this have on the teams they leave behind? Lastly, teams are losing significant amounts of time due to competing priorities causing overwhelming stress on an already heavy workload.
23.4% of people feel like their workload has increased due to The Great Resignation.
- Individual contributors: 22.7%
- Managers: 21.4%
- Senior leaders/execs: 27.3%
78.7% of people experience stress due to increasing tasks and lack of time to get it all done every week.
- Individual contributors: 81.8%
- Managers: 71.4%
- Senior leaders/execs: 81.8%
On average, users report spending 10.8% of their workweek recovering and catching up after having to reprioritize their work.
- Individual contributors: 12.1%
- Managers: 10.6%
- Senior leaders/execs: 8.5%
A shocking 23.4% of professionals are feeling the pain of The Great Resignation, as that work once performed by their fellow employees is now falling on their plates. This pain is surprisingly felt most at the top with 27.3% of senior executives experiencing an increased workload due to The Great Resignation vs. 22.7% of employees. But it's not just The Great Resignation that's driving strain on professionals: over 75% of people are experiencing stress every week due to increasing task loads and lack of time to get it all done.
Individual contributor statistics across project management platforms
In this Task Management Trends Report, we captured and analyzed these findings across project management platforms Jira, Todoist, Asana, Trello and ClickUp so you can see how these trends break out across your tool of choice.
Individual contributor task completion across project management platforms
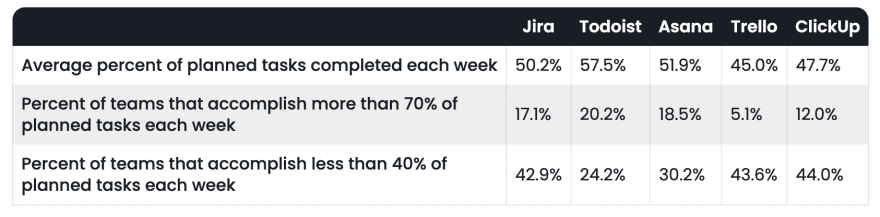
While the average individual contributor completes 53.5% of their weekly planned tasks, this data varies dramatically across project management platforms. Todoist users report the highest task completion rate at 57.5%, while Trello users report the lowest at 45.0%, over a 12 point difference between tools. This is not to say that Todoist users accomplish more than Trello users, but to represent how users of these project management platforms capacity plan and estimate out their task load every week.
Individual contributor time spent on tasks across project management platforms

Now, let's look at the time individual contributors spend on tasks across project management platforms. While the average worker works on tasks for 4.2 hours a day, Jira users report the most time spent on tasks at 4.9 hours a day compared to just 3.7 hours users of Asana, a full 1.2 hour difference across platforms daily, and 6 hour difference every week. IC users at Trello reported the highest percentage of users who spend more than 6 hours a day on task work at 20.5%, while ClickUp reported the highest percentage of users who spend more than 4 hours a day on tasks at 64%.
Individual contributor task productivity across project management platforms

The average percent of individual contributors task time spent on productive, focused work is 53.3%, which is actually very consistent across all of our project management platforms. Though the percent who are productive more than 70% of their task time varies from a high of 14.3% at Jira and a low of 7.9% at Trello. We also saw more variation in the average number of productive task hours, leading at 2.7 hours a day at Jira compared to the lowest reported 2.0 at Asana. However, Asana IC users also reported the lowest number of hours wasted on unproductive task work at 1.8 hours a day, compared to both Jira and ClickUp IC users, who reported 2.2 unproductive hours.
Individual contributor time defense for tasks across project management platforms
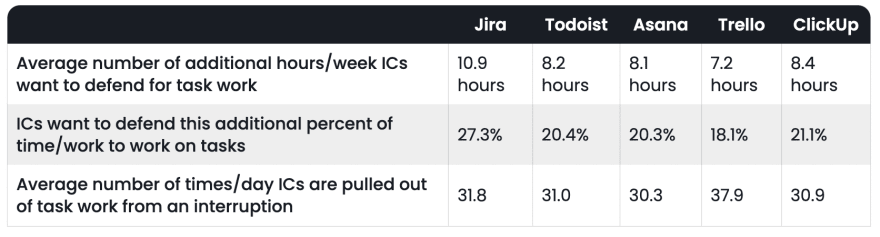
So how much additional time do individual contributors want to catch up on their task lists? The average person wants to defend 8.3 additional hours per week for tasks, and as high as 10.9 hours at Jira compared to the lowest reported 7.2 additional hours at Trello. It's important that individual contributors defend this time, as the average person is interrupted 31.6 times a day from their task work, or as high as 37.9 times a day for Trello users.
Manager statistics across project management platforms
Now let's look at the data we analyzed above for managers across popular project management platforms Jira, Todoist, Asana, Trello and ClickUp.
Manager task completion across project management platforms
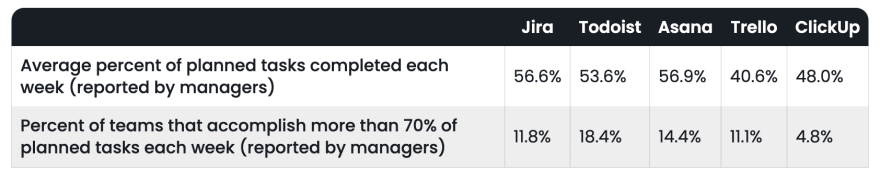
The average percent of planned tasks completed each week (as reported by managers) is 52.6%, and similar to the data reported by individual contributors, this data varies greatly across project management platforms. Asana managers reported the highest task completion rate at 56.9%, compared to just 40.6% of tasks completed at Trello.
Manager time spent on tasks across project management platforms
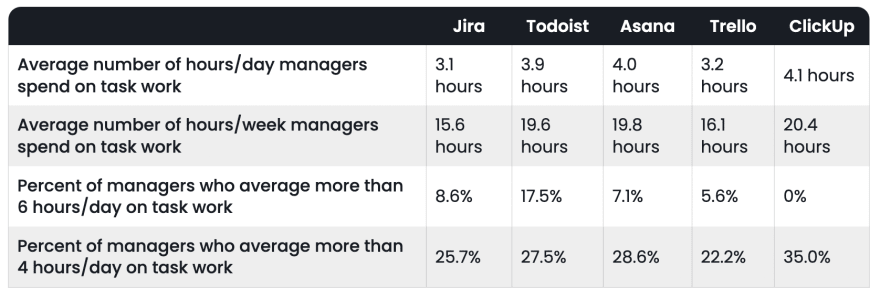
Managers across these project management platforms reported within one hour of each other for the average number of hours they spend a day on their own task work. Managers using ClickUp reported the highest at 4.1 hours a day compared to Jira at 3.1 hours a day, and right in the middle the average across all platforms at 3.6 hours a day. And while ClickUp is the highest on average, 0% of managers using ClickUp reported spending more than 6 hours a day on task work while 17.5% of managers using Todoist spend more than 6 hours a day working on their tasks.
Manager task productivity across project management platforms

Just over half of the time managers spend working on tasks is reported as productive on average, ranging from the lowest reported 45.6% at Trello to the highest 50.9% at Jira. We also saw the widest in reporting across the entire report here for percent of managers who are productive in more than 70% of their task time. Managers using Asana reported just 4.8% compared to over 4x higher results at Jira.
Manager time spent on prioritizing tasks across project management platforms

Managers are not just responsible for themselves, but for all of the individual contributors they manage, and average 5 hours a week just assigning, prioritizing and reprioritizing work across their team. Managers using the Todoist reported the lowest amount of hours at just 3.8 per week, compared to 6.1 hours by managers using Jira. Zero managers using Todoist reported spending more than 14 hours a week assigning, prioritizing and reprioritizing work across their team, while 31.6% of managers using Jira do.
Manager time defense & self-ranking across project management platforms
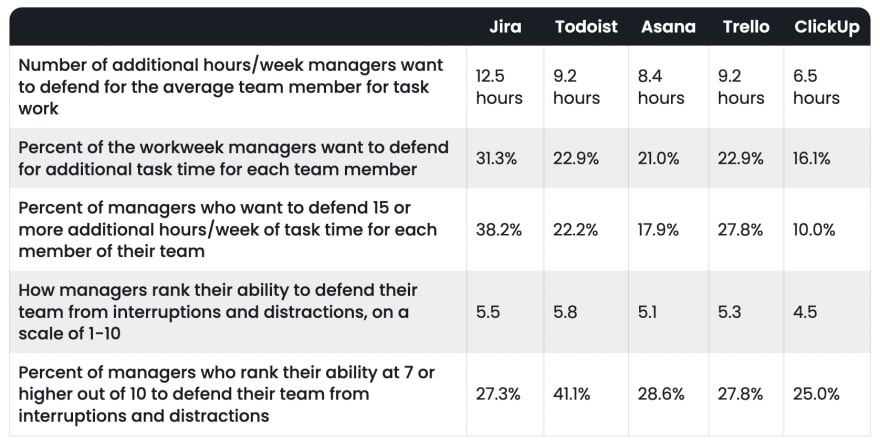
Another important stat for managers is how much additional time they want to defend for their direct reports, and the average manager wants to defend an additional 9.4 hours for each team member every week to work on tasks. Managers using Jira reported the highest average of 12.5 hours for each team member, compared to the lowest 6.5 hours the average manager using ClickUp reported. And while managers desperately want to defend this time, managers using ClickUp only rank their ability at a 4.5/10 for defending their team from interruptions, and the highest with Todoist where managers ranked themselves at 5.8/10.
Reclaim ROI statistics
At Reclaim, we pulled together this report to help us understand the task management needs of our users, and discover how we can provide more value across all organization types. We know each item on your task list takes time, and that's why it's so hard to get it all done -- here's a look at how individual contributors, managers and senior leaders rate their abilities when using Reclaim + their task managers.
Users are able to defend 29.3% of their workweek for productive, heads-down work.
- Individual contributors: 34% of their workweek
- Managers: 25% of their workweek
- Senior leaders/execs: 26% of their workweek
This is the total percentage of busy professionals workweeks that Reclaim is able to help them defend for productive task work alone, not including time spent on work items like answering email, hopping around Slack, or browsing to-do lists. Individual contributors, the employees responsible for accomplishing most of the task across an organization, are seeing the largest benefit here, defending 34% of their workweeks for important focused work assigned to them through their project management integration.
Users are able to defend 5.7 additional hours per week for productive task work.
- Individual contributors: 5.1 additional hours
- Managers: 7.8 additional hours
- Senior leaders/execs: 4.3 additional hours
While professionals are now defending almost 30% of their workweek on their calendar for productive task work, they are also able to defend an additional 5.7 hours on average each week through the task integration. Managers actually experienced the most value here, defending an additional 7.8 hours on average, almost 20% of their entire workweek, to dedicate to their own task work. Middle managers especially are often caught juggling the most meetings between direct reports, reporting to upper management, and communicating across teams and departments, which is why it's so important they defend the time they need to get their actual work done on their calendars.
Users reported a 12.1% increase in their ability to accurately estimate projects and capacity plan sprints.
- Individual contributors: 8.4% better
- Managers: 7.1% better
- Senior leaders/execs: 26.0% better
Another major advantage Reclaim offers is the ability to actually visualize and map what can be realistically accomplished in a week by integrating your task list with your calendar. Reclaim task integration users are improving their ability to accurately forecast their project estimates and capacity planning for their sprints by 12.1%. Senior leaders and executives reported the most significant increase of an astonishing 26% as they can better reflect on the overall goals and priorities affecting the organization at large.
Users reported being able to avoid or say no to an additional 2.3 meetings/week by communicating task work through their calendars.
- Individual contributors: 1.9 meetings
- Managers: 2.8 meetings
- Senior leaders/execs: 2.4 meetings
Another extremely important factor in busy professionals productivity is making the hard decisions on what they don't have time for. With Reclaim's task integrations, professionals on average are able to say no to an additional 2.3 meetings each week by representing their own priorities via task time blocks on their calendars. Managers and senior leaders reported the highest number of meetings avoided due to the higher volume of meetings on their calendars.
Users reported a 41.1% improvement in being able to better prioritize their work and determine what to take on next.
- Individual contributors: 39.5% better
- Managers: 40.8% better
- Senior leaders/execs: 44.5% better
Lastly, how do busy professionals optimize the limited time they have for tasks? By reducing the decision paralysis of what to take on next. Reclaim users reported a 41.1% improvement in prioritizing their work using a Reclaim task integration, with the highest results experienced by senior leaders at a 44.5% improvement.
At Reclaim, we're focused on helping busy professionals make time for their important work, even in the busiest, most chaotic of schedules. Stay tuned for our next productivity trends report on how teams are optimizing their workweeks in the modern workplace.

Latest comments (1)
Great insights. It is very interesting to see how productivity differs depending on the task management tools used.