Integrating Xdebug on PhpStorm has been always hectic, something always comes up which makes you to go through number of guides on the web and cost lot of time, if you are lucky you will somehow manage to integrate successfully otherwise keep on looking...
I faced this kind of situations multiple times in past and one more recently with macOS Catalina. I managed to integrate successfully after spending quite bit of time but this time, I would like to share my findings with you so that you don't have to bang your head on the wall :)
The problem with macOS Catalina is that, Apple decided to nuke /usr/include which has been the default location for C header file in UNIX systems. I tried to install through pecl install xdebug but got the error as the compiler was looking for necessary headers file in /usr/include, so it didn't work out. Then, I end of compiling Xdebug manually by specifying the actual location of the header files which are provided by Xcode but in a different location. It went good and now working like a charm.
Let's begin the chapter.
Installing Xcode
The first step is to get Xcode from the App Store.
After installing Xcode, it is time to get the command line tools:
xcode-select --install
If this command fails, you might need to open Xcode and accept the terms and conditions to finish the installation. I am using Xcode 11.5 beta.
Now, make sure that the path for SDK is found. It could be possible that your path does look a bit different than the one below. If so, then you might need to change the path accordingly later on.
$ xcrun --show-sdk-path
/Library/Developer/CommandLineTools/SDKs/MacOSX.sdk
Getting source from GitHub
I am using 2.7.0 which is supported version for PHP 7.3 and PHP 7.4. You can check the version compatibility to find the right one for your project.
If you like checking out different versions of Xdebug, you could do it from GitHub.
git clone https://github.com/xdebug/xdebug.git
cd xdebug
git checkout tags/2.7.0
While checking out if you get the following error then you need to exclude Users/ directory in the config:
fatal: cannot use /Users/yourname/ as an exclude file
Excluding Users/ directory in the config:
Path: xdebug/.git/config
You might need to show hidden files by pressing shift+cmd+.
[core]
      excludesfile = Users/
phpize
Now, it is time to make a copy of phpize and to edit the include path:
cp /usr/bin/phpize .
nano ./phpize
Find this line:
includedir="`eval echo ${prefix}/include`/php"
and replace it with the line below if your SDK path is /Library/Developer/CommandLineTools/SDKs/MacOSX.sdk and if not then use your SDK path which you have already found previously and append /usr/include/php in that path
includedir="/Library/Developer/CommandLineTools/SDKs/MacOSX.sdk/usr/include/php"
Run phpize:
./phpize
You should now see something like this:
Configuring for:
PHP Api Version:         20180731
Zend Module Api No:      20180731
Zend Extension Api No:   320180731
Installing autoconf
Run following command for building and installing it:
./configure --prefix=/usr/local
make
sudo make install
Configure and build Xdebug
We can now configure:
./configure

#run following commands for specifying custom SDK location as compiler flags

SDK_PATH=$(xcrun --show-sdk-path)
make CPPFLAGS="-I${SDK_PATH}/usr/include/php -I${SDK_PATH}/usr/include/php/main -I${SDK_PATH}/usr/include/php/TSRM -I${SDK_PATH}/usr/include/php/Zend -I${SDK_PATH}/usr/include/php/ext -I${SDK_PATH}/usr/include/php/ext/date/lib"
You might see some warnings but can be ignored. Now, its time to run:
make install
You might see the Error like below and which makes sense because it can't move the extension to the right place due to System Integrity Protocol (SIP) will not allow it. Therefore, we will take care of this manually at the next step. make install is still required as it will sign the *.so file.
Installing shared extensions:     /usr/lib/php/extensions/no-debug-non-zts-20180731/
cp: /usr/lib/php/extensions/no-debug-non-zts-20180731/#INST@13740#: Operation not permitted
make: *** [install-modules] Error 1
Enabling Xdebug in PHP
Lets move the executable to /usr/local/php/extensions.
sudo mkdir -p /usr/local/php/extensions
sudo cp $(php-config --extension-dir)/xdebug.so /usr/local/php/extensions
Now, we enable Xdebug by editing the PHP configuration in php.ini.
Lets locate the file:
cd /etc
tail php.ini
php.ini          php.ini.default

#If you don't find php.ini, then you can just copy the default one

cp php.ini.default php.ini
Editing the configuration:
sudo nano php.ini

#Add the following at the bottom and save it

[xdebug]
zend_extension=/usr/local/php/extensions/xdebug.so
xdebug.remote_enable=on
xdebug.remote_log="/var/log/xdebug.log"
xdebug.remote_host=localhost
xdebug.remote_handler=dbgp
xdebug.remote_port=9000
Restart build in server:
sudo apachectl restart
Here comes the moment of truth:
php -i | grep "xdebug support"

#If the above command returns following outcome then you are set to go :)
xdebug support => enabled
Lets open the second chapter...
Configure Xdebug in PhpStorm
- In the Settings/Preferences, select Language & Frameworks|PHP.
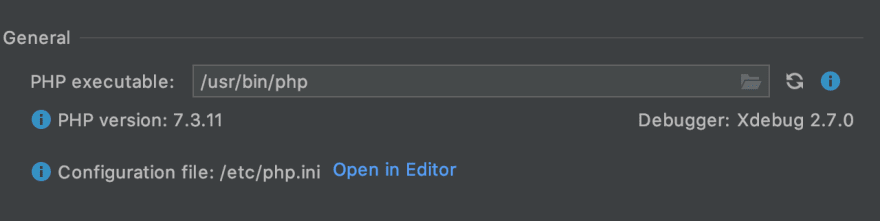
- On the PHP page, choose the relevant PHP installation from the CLI Interpreter list and click the browse button (...) next to the field.

- The name and version of the debugging engine associated with the selected PHP installation shows up here. If debugger is properly configured, PhpStorm shows the message:
- Now, click Run|Edit Configurations... from the menu which will open the dialog box
- Add server configuration by clicking + icon and choose PHP Remote Debug

- Name: provide whatever name you like to call for your remote debug
- Filter debug connection by IDE key: checked
-
Server: click the browse button (...) next to the field to create one

- Above example shows the localhost setup, you can use mappings if the server is remote or symlinks are used
- IDE key(session id): PHPSTORM
- Session id has to be exactly same with the one from the Xdebug browser extension, it will come up in next step
- Apply the configurations
Lets test the configuration
- Click Run|Web Server Debug Validation, it will open the dialog box
- Provide path for the project and Url and click Validate, if you see something like this below then you are all set.

- One last thing is left which is adding Xdebug helper as an extension in google chrome.
- After adding it, right click on the Xdebug helper which will open the menu, you could find it on the top right section of the google chrome.

- Click on Options from the menu
- Select your IDE and provide the sessionkey, previously we have used PHPSTORM, we will use the same one here

- Don't forget to activate the Xdebug helper, just click on the icon and click Debug from the menu, it will turns into green.
- Activate Start listening for PHP Debug Connections by clicking on following icon in PhpStorm, when it is activated it turns into green.

Thats it.
Set some breakpoints, run the project and 💥
Keep coding! Keep debugging! 👊

Top comments (1)
Have you tried using ServBay?
It is a good tool, especially for the beginners. It handles all PHP, MariaDB, PostgreSQL versions, plus Redis and Memcached. Run multiple PHP instances simultaneously and switch easily. This tool has made my PHP dev simpler. Worth a shot!