Whenever we think of JavaScript debugging 🤔 console.log, debugger, browser dev tools are some terms that come up in our mind but have you ever thought of debugging JavaScript with IDE?
This post will guide you to integrate JavaScript debugging in PhpStorm in no time.
Lets get started...
Step1 - Install JetBrains IDE Support extension
First of all, you need to install JetBrains IDE Support extension for Google Chrome to debug client-side apps in any IDEs from JetBrains.
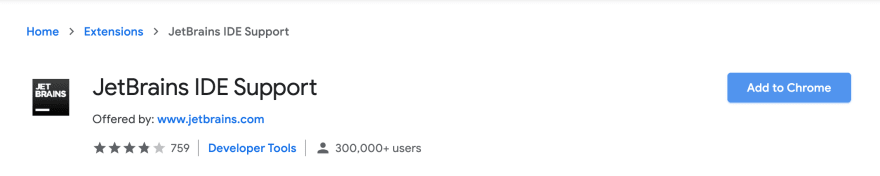
After installing the extension, now you should see the JetBrains icon in your google chrome panel.

Step2 - Add JavaScript Debug configuration in PhpStorm
Click Run|Edit Configurations... from the menu which will open the dialog box and add configuration by clicking + icon and choose JavaScript Debug as a new configuration. Provide your Name for the configuration and URL for the server.

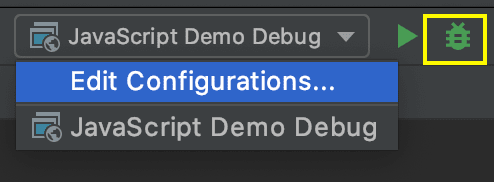
Step3 - Start debugging
Choose the right debugging configuration and start debugging by clicking on the debug icon.
This will open your project in the new browser.

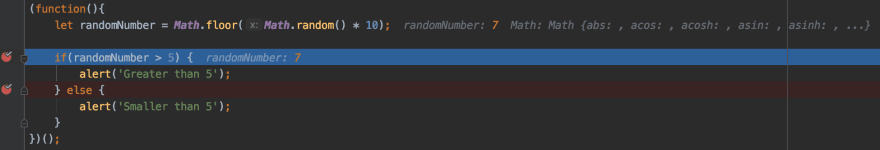
If you set the breakpoints, you would see the script stops at the breakpoints.
Congratulations! 👏 You have just integrated JavaScript Debugging successfully!
Keep on coding & keep on debugging 🐞

Top comments (1)
good one baba!