
In Part I, I covered the basics of Custom View development. This time I want to tell you in detail how you can render a chart. Reach out for your artistic toolkit, and let’s add some detail and shade to your sketch!
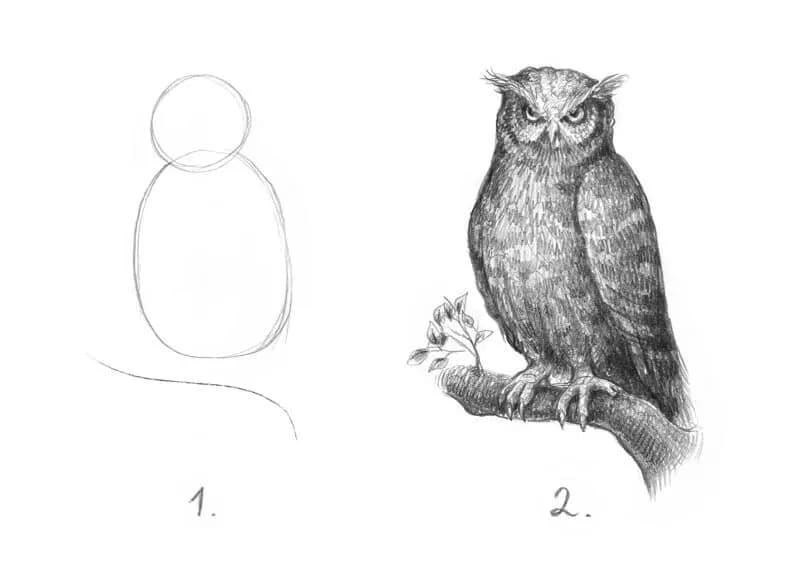
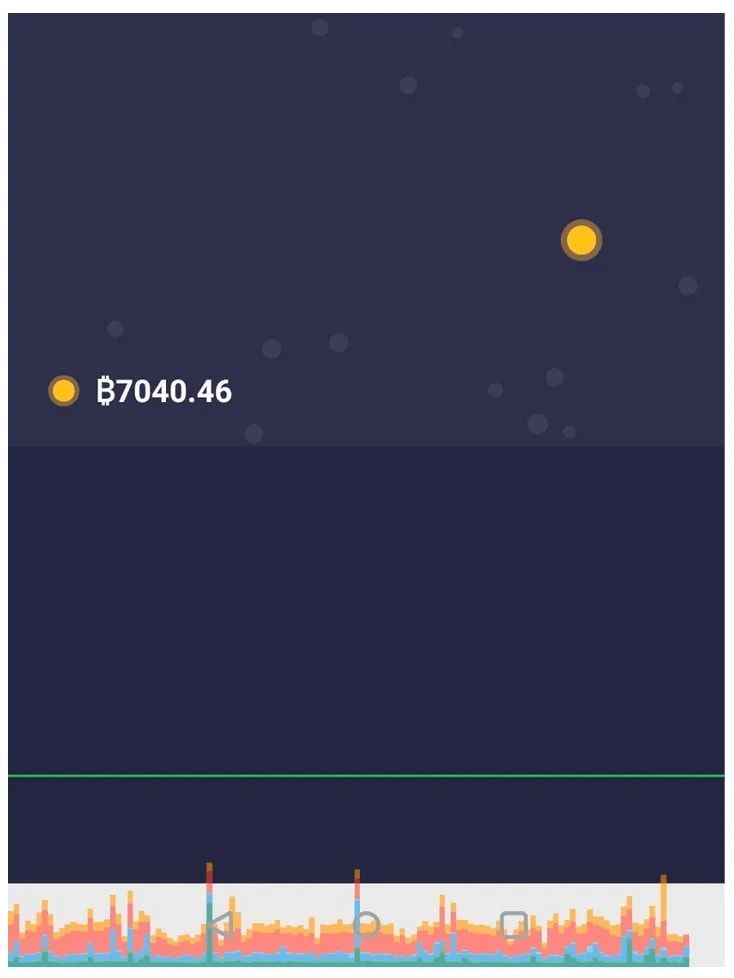
This is our goal. Impressive, huh?

For starters, we’ll define the logical structure of our View. After that, we’ll move on to rendering, and look closer at each layer. I’ll show you how to debug the View and profile GPU rendering. And then — finally! — we’ll launch our app for the first time.
The logic of View
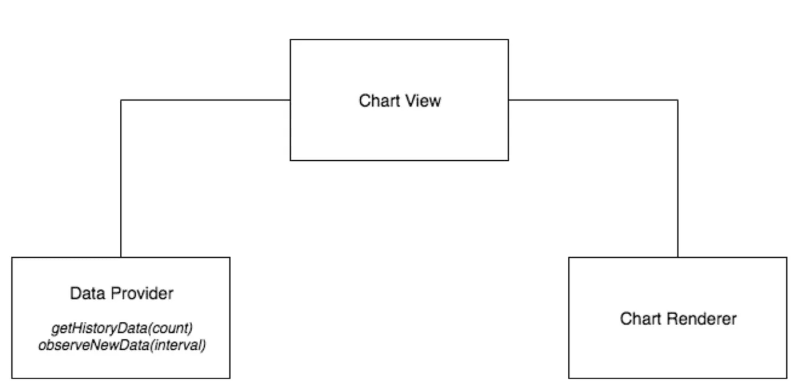
The View contains two objects — DataProvider and ChartRenderer. These two objects allow us to customise and test the chart flexibly. For example, you can implement a test configuration by using DataProvider with predefined values.
The DataProvider interface is presented by the two methods:
getHistoryData — gets the initial set of data,
observeNewData — subscribes to updates that determine how our chart will move.
While the ChartView is responsible for display and animation, the ChartRenderer contains the logic for chart drawing.
class ChartView @JvmOverloads constructor(
        context: Context,
        attrs: AttributeSet? = null,
        defStyleAttr: Int = 0
) : View(context, attrs, defStyleAttr) {
    lateinit var dataProvider: DataProvider
    lateinit var chartRenderer: ChartRenderer
    private var disposable: Disposable?

    override fun onAttachedToWindow() {
        super.onAttachedToWindow()
        chartRenderer.init(dataProvider.getHistoryData(15))
        disposable = dataProvider.observeNewData((1000 / SPEED).toLong())
                .subscribe(this::addValue)
    }

    override fun onDetachedFromWindow() {
        super.onDetachedFromWindow()
        disposable?.dispose()
    }

    fun addValue(value: Double) {

    }
}
As you can see, we subscribe to changes in onAttachedToWindow and unsubscribe in onDetachedFromWindow. Of course, you may argue whether it’s reasonable to implement this logic inside the View. At Revolut, we do so for the sake of simplicity and clarity.
observeNewData in this example means Observable RxJava, but you may substitute it with any other technology used in your project.
If you want to publish your View, remember these key points:
- Make sure you remove dependencies on third-party libraries.
- Remove unnecessary logic. You can eliminate DataProvider as an entity because the View isn’t responsible for it. The end user should call the addValue, setValue and other methods instead, depending on the chart type.
Now let’s move on to the next step — rendering on Canvas.
Rendering on Canvas
First I have to say a few words about hardware acceleration here, and show you the coordinates grid. Then I’ll describe how layers are drawn. We’ll take a look at each layer separately — the background, the chart, the state marker, and the text.
Hardware acceleration. It’s 2023, and we‘ve forgotten about Android 4.4 now, right? This means that there should be no obstacles in the way of supporting hardware acceleration. However, this isn’t completely true. You still have to check with the Android documentation and see which functionality is supported when you apply acceleration.
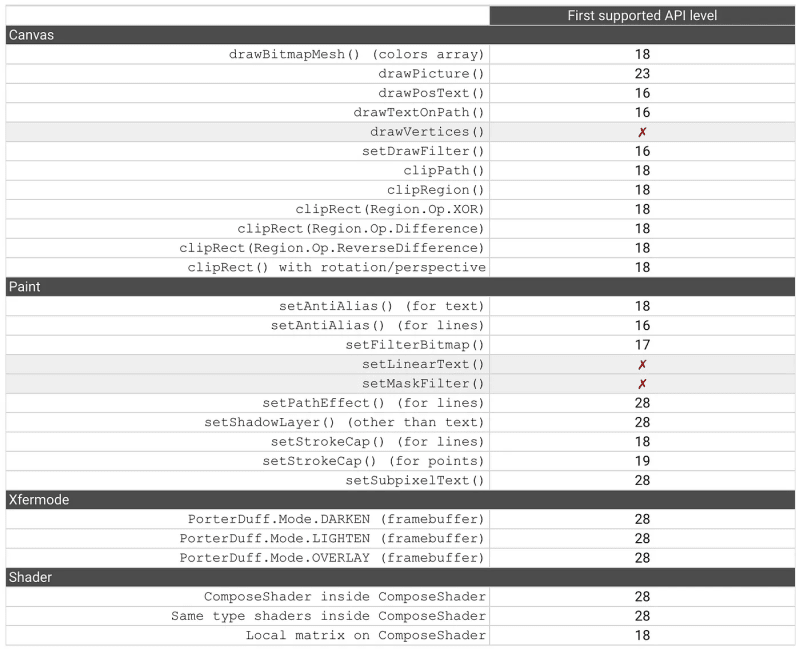
The documentation contains a more detailed table than this one. As you can see, some capabilities are available only for Android 9 (28), and some are not available at all. For example, unfortunately drawVertices is unavailable, and it’s the only way to draw polygons without using Path.
Coordinates grid. This is another important thing that you really need to remember — the starting point is in the top left corner. Even I still forget about it sometimes!

Drawing layers (onDraw)
fun onDraw(canvas: Canvas) {
    canvas.drawPaint(backgroundPaint)

    stars.forEach { it.draw(canvas, skyPaint) }

    chartRenderer.draw(canvas, markerDotX, canvas.height.toFloat())

    drawCurrentValueMarker(canvas)
}
This is how the onDraw method works. It draws all the View layers one by one.
drawPaint — fills our Canvas with the colour defined in Paint.
Next, onDraw renders the sky (background) and the chart and finishes with the current state marker and text.
The background (drawCircle)
To draw each circle in the background, call the drawCircle method from Canvas.
canvas.drawCircle(x, y, radius, paint)
The parameters x, y, radius define the size and position of the circle. The Paint parameter defines the style, namely the colour in our case.
val paint = Paint(Paint.ANTI_ALIAS_FLAG).apply {
    color = Color.WHITE
    alpha = 20
}
You can optimise this part. If it suits your purpose for all your circles to have the same radius, you can use a primitive.
canvas.drawPoint(x, y, paint)
However, the dots are square by default, being 1px in size. To fix this, let’s write a separate sky Paint.
val skyPaint = Paint(Paint.ANTI_ALIAS_FLAG).apply {
    color = Color.WHITE
    alpha = 20
    strokeWidth = radius * 2
    strokeCap = Paint.Cap.ROUND
}
Note that the strokeWidth defines the dot diameter.
Define the Paint parameter outside of the onDraw method to make sure you don’t put too much load on the Garbage Collector (GC).
The next thing we want to make is a loopable background without creating new objects every time. Let’s apply some simple mechanics: when the circle has reached beyond the screen, we just place it back on screen in a random place within the red area. The circle always moves to the left. Thanks to this little lifehack, it looks as if the background is infinite.

interface Entity {
    fun onFrame(frameTimeMillis: Long, chartSpeed: Int)

    fun draw(canvas: Canvas, paint: Paint)
}

class SkyEntity(private val parent: View) : Entity {
    private var x = -1f
    private var y = 0f
    private var radius = 0f
    private var speed = 0f

    init {
        generateNewValues(true)
    }

    private fun generateNewValues(initial: Boolean) {
        speed = 6.dpToPx(parent) * (4 + Random.nextFloat())
        radius = 3.dpToPx(parent) * (1 + Random.nextFloat())

        val dx = if (initial) 0 else 1
        x = parent.width * (dx + Random.nextFloat())
        y = parent.height * Random.nextFloat()
    }

    override fun onFrame(frameTimeMillis: Long, chartSpeed: Int) {
        if (x < -radius) {
            generateNewValues(false)
        }
        x -= speed * (frameTimeMillis / 1_000f) * chartSpeed
    }

    override fun draw(canvas: Canvas, paint: Paint) {
        canvas.drawCircle(x, y, radius, paint)
    }
}
The chart line (ChartRenderer)
interface ChartRenderer {
    fun setValues(values: List<Double>)

    fun addValue(value: Double)

    fun onFrame(frameTimeMillis: Long, speed: Int)

    fun draw(canvas: Canvas, clipWidth: Int, clipHeight: Int)

    fun getChartItemByScreenX(x: Float): ChartItem
}

data class ChartItem(val y: Float, val value: Double)
The ChartRenderer interface uses 4 methods:
- setValues — sets values to create the chart
- onFrame — is called before rendering each frame
- draw — draws the chart
- getChartItemByScreenX — allows us to define the point on our chart and its value for the marker based on the X coordinate.
Now we’ll draw a chart using Paths. This process is iterative.
canvas.clipRect(0f, 0f, clipWidth, clipHeight)
canvas.translate(-offset, 0f)

canvas.drawPath(chartBackgroundPath, fillPaint)
canvas.drawPath(chartLinePath, linePaint)
The chart’s line and fill are each defined by a Path. There are several Paint styles you need to know:
- STROKE is used to draw a line
- FILL is used to colour an item0
- FILL_AND_STROKE won’t draw a line with colour, as you might have expected. It’s a FILL style that takes into account the strokeWidth value
clipRect cuts the chart to the required width.
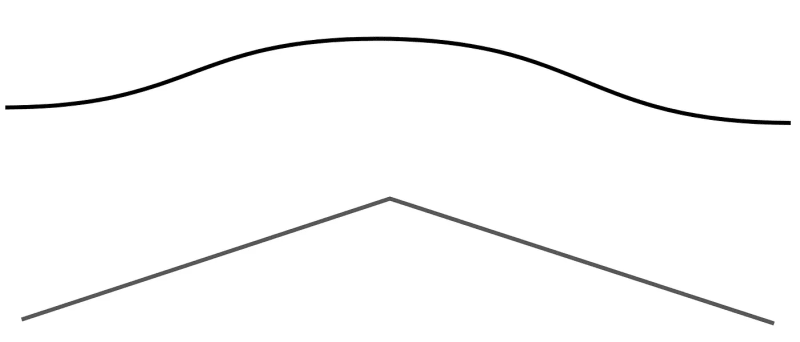
Now let’s smooth our step chart. For the line to run smoothly from one value to another, we need to make the line curvy. There are at least two ways to draw a curve in Path. The Bezier curve is the first and most flexible way to do it. Our second option could be a pathEffect parameter — or CornerPathEffect in our case — where we can specify the radius of the rounded angles.
paint.pathEffect = CornerPathEffect(10)
We use the Bezier curve, as it’s the most appropriate for our needs. Later, I’ll show you why the second option won’t work. To create the chart using the Bezier curve, you just need to write a small piece of simple code.
values.reduce { previous, current ->
    val deltaHeight = previous.toChartY() - current.toChartY()

    chartLinePath.rCubicTo((batchWidth * LINE_CURVE_FACTOR), 0f,
                           batchWidth - (batchWidth * LINE_CURVE_FACTOR), deltaHeight,
                           batchWidth, deltaHeight)

    current
}
Let’s take a closer look at the rCubicTo method. It uses 3 pairs of coordinates as the input — the first two pairs are coordinates of control points, and the third pair are the coordinates of the end point in the curved line. batchWidth — is a step in the graph, LINE_CURVE_FACTOR — is the extent of the smoothing (e.g. 0.5).
Now let’s see how smoothing works.

P0 is the starting point of the curve, Р3 is the end point. Р1 and Р2 are control points — you can move them to make the curve look how you want. You don’t have to provide absolute values here: ‘r’ in rCubicTo stands for ‘relative’, so the chart moves in relation to the previous coordinate values. Thus rCubicTo allows you to leave the starting point value undefined, because it can use the end point from the previous iteration.
override fun draw(canvas: Canvas, clipWidth: Float, clipHeight: Float) {
    canvas.save()

    canvas.clipRect(0f, 0f, clipWidth, clipHeight)
    canvas.translate(-offset, 0f)

    canvas.drawPath(chartBackgroundPath, fillPaint)
    canvas.drawPath(chartLinePath, linePaint)

    canvas.restore()
}

//invoked with a new data
private fun recreatePath() {
    val bottom = parent.height - parent.paddingBottom.toFloat()
    chartLinePath.rewind()
    chartLinePath.moveTo(-batchWidth, bottom)
    chartLinePath.rMoveTo(0f, -values.first().toChartY())

    values.reduce { previous, current ->
        val deltaHeight = previous.toChartY() - current.toChartY()

        chartLinePath.rCubicTo((batchWidth * LINE_CURVE_FACTOR), 0f,
                batchWidth - (batchWidth * LINE_CURVE_FACTOR), deltaHeight,
                batchWidth, deltaHeight)

        current
    }

    pathMeasure.setPath(chartLinePath, false)

    chartBackgroundPath.set(chartLinePath)
    chartBackgroundPath.rLineTo(0f, parent.height.toFloat())
    chartBackgroundPath.rLineTo(-batchWidth * (values.size - 1), 0f)
    chartBackgroundPath.close()
}
Let’s take a look at the chart now.

Okay, so what’s left?
- The current state marker
- The text
The marker
Since the marker must follow the chart change, we need to be able to determine the Y coordinate based on the constant X coordinate. To determine a point on an open Path, we’ll use PathMeasure. We need to specify our Path to initialise it.
paintMeasure.setPath(chartLinePath, false)
boolean getPosTab(float distance, float pos[], float tan[])
To determine the position, we call the method getPosTan — it accepts three parameters as input:
- Distance — is the length of the contour from the beginning to our point.
- Pos / Tan — are arrays where data about the point (its position and tangent) will be written. In our case, we can omit the third parameter.
So how do we get a point on the chart based on the screen coordinate X? Let’s try the binary search.
You might think that we can calculate the coordinate using the formula, because we know the following three factors:
- How we build the curve
- That we don’t have loops
- The coordinates of all chart segments
However, it’s not that complicated. The binary search is simple, clear and universal.
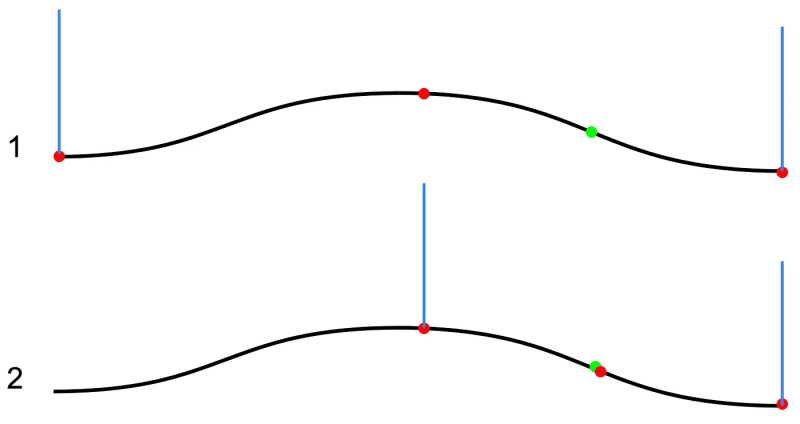
We know that our point lies within a certain range. We take the average value and check its coordinates. If the X coordinate is too far from the required coordinate, then we should narrow the range by half and repeat until the required point is as close as possible.
The red dots and blue lines define the limits of our search range. The red dot in the middle is the coordinate we’re checking. The green dot indicates the point we’re looking for.
The first iteration shows that the point in question is pretty far from the center of the range. So we can reduce the range by half because we know that our point is on the right. In the second iteration, we find the value of the point. This algorithm is kind of rough, but it works.
private fun findYOnChart(x: Float): Float {
    val coordinates = floatArrayOf(0f, 0f)
    var rangeStart = 0f
    var rangeEnd = pathMeasure.length
    var midDistance: Float

    while (rangeStart.farFrom(rangeEnd, POINT_LOOKUP_TOLERANCE)) {
        midDistance = rangeStart + (rangeEnd - rangeStart) / 2
        pathMeasure.getPosTan(midDistance, coordinates, null)
        when {
            coordinates[0].closeTo(x, POINT_LOOKUP_TOLERANCE) -> return coordinates[1]
            coordinates[0] < x -> rangeStart = midDistance
            else -> rangeEnd = midDistance
        }
    }

    return coordinates[1]
}
Your code will look something like this. In the loop, we check all points until we find the necessary one, or until the range becomes minimal.
Why won’t CornerPathEffect work for us?
The answer is pretty simple. PathEffect is used at the rendering stage (this means that the input values are not transformed). PathMeasure uses data from Path.
On the screen, we see the smooth line of the chart, but it won’t be like this for PathMeasure. So we won’t be able to find a point on the graph.
Now we know how to position the graph, only the text is left.
The text (getTextBounds)

As you can see in the image, the text and the marker on its left are horizontally centered. Simply using canvas.drawText won’t give us this effect. For example, if we specify the Y coordinate which equals to the marker coordinate, we’ll get the following:

To get a better result, we need to know the text height. getTextBounds can help us out.
val textBounds = Rect()
...
textPaint.getTextBounds(valueText, 0, valueText.length, textBounds)
canvas.drawText(valueText, currentValueLabelOffset + smallDotRadius * 2f,
                view.height - currentValueLabelOffset + textBounds.height() * 0.5f - textBounds.bottom, textPaint)
view raw
This method returns the Rect-type object containing info on the text height. It’s also worth noting that different fonts may differ in other parameters too, not only height.
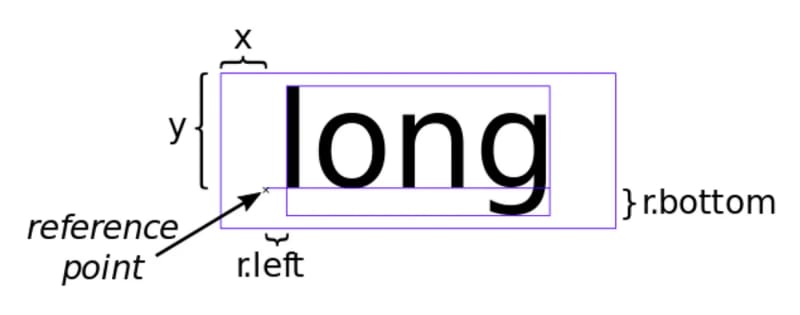
The bottom indent, for example — you have to take it into account when you centre the text.
Looks like we’ve done all the preparation work! I guess you want to start the app already — we’re almost there. One last thing — debugging.
Debugging & Profiling
To debug your View, it’s enough to turn on the profiling of the GPU renderer. It’ll be able to show all the performance issues. If you have concerns about the memory usage, then you should get the built-in profiler in the Android Studio.
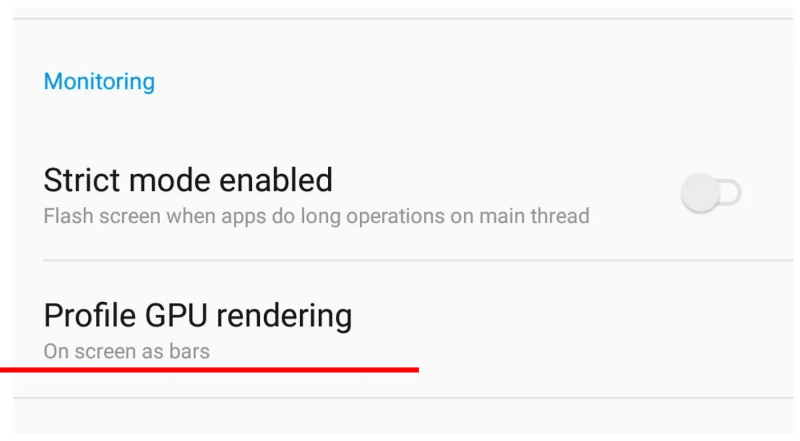 Turn on profiling in the developers’ settings
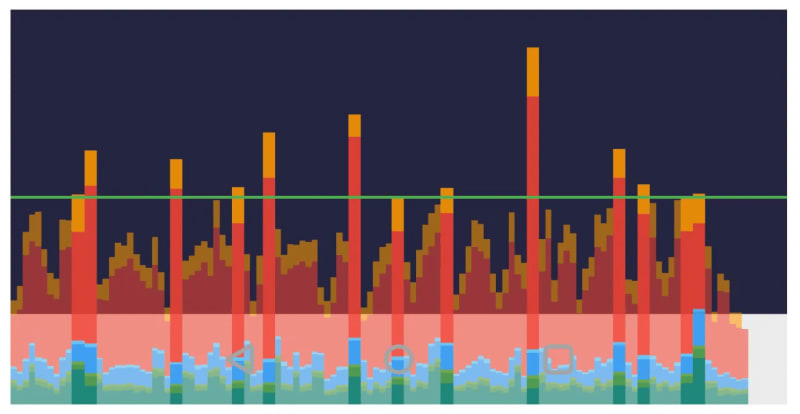
A profiler looks like this image; a set of columns showing the processing time of each frame. The green line indicates the threshold value — if reached and exceeded, the frame is skipped. On the screens that refresh at the standard rate of 60 Hz, it takes about 16 ms to process a frame.
Note also that each column consists of coloured segments. They visualise which part of the renderer consumes most of the resources.
![]()
In Android documentation, you’ll find a description of each step. When we draw using onDraw, we’re only interested in the final few steps:
- Draw. The onDraw method (and not just yours) affects this step. Long execution will cause problems.
- Sync & Upload. Namely, loading the bitmaps and lists for GPU rendering. Issues arise because of a large amount of data and hardware limitations (for example, slow memory).
- Command Issue. It’s responsible for calling OpenGL (or Vulkan) commands on the GPU. Calling more commands results in longer execution.
- Swap Buffers. The final step where the CPU is waiting for the GPU to shut down. You can often see this problem if you are profiling on an emulator.
And another useful setting, which may help you optimize rendering, is the Overdraw Visualization. I won’t elaborate on this now, but just note that this setting helps you see which Views are drawn more than once per frame.
General recommendations on profiling
- Prioritise using a real device over the emulator.
- Check using different APIs.
I’ve singled out the 4 versions of Android that you might need to consider:
- KitKat: I hope you don’t have to support this version. But if you do, just remember that rendering is performed in the UI thread here.
- Lollipop: RenderThread was added to the system starting from this version.
- Marshmallow: I’m not aware of its peculiarities, but various issues are associated with this version, so do your research and stay alert.
- Oreo: The rendering pipeline was upgraded in this version eliminating the need to call invalidateRect.
Newer versions work just fine for us (yay!).
Now we’re ready to start our app. Let’s go.
First launch

Everything works as expected. However, the Profiler shows that the rendering of some frames takes more than 16 ms. Frames are skipped as a result, and we may notice some stuttering.
Later the chart becomes even slower.

In the end, it just disappears.
What happened? To find out, you’ll have to come back for the next and final part in this series. Stay tuned to learn about Performance and Optimisation!

Top comments (0)