Introduction to ELK Stack
Logs are everywhere in every app, server, and system generates them. But when something goes wrong, digging through endless log files to find the issue can be so overwhelming. Here ELK turns raw log data into clear, searchable, and visual insights.
What is the ELK Stack?
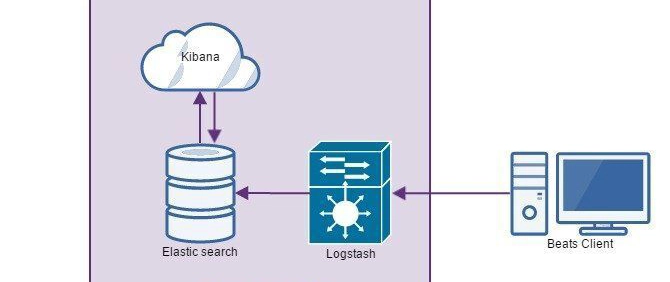
The ELK Stack is an open-source log management and data analytics tool made up of:
Elasticsearch – A search engine that stores and retrieves log data quickly.
Logstash – A tool that collects, processes, and forwards logs.
Kibana – A dashboard for visualizing and analyzing log data.
Together, these tools make it easy to collect, search, and analyze logs in real time, helping teams troubleshoot issues, monitor systems, and make data-driven decisions.
Why is ELK Important?
Modern applications generate tons of log data, and manually searching through it isn’t practical. ELK helps by:
✔️ Finding issues fast – Instantly search massive log files.
✔️ Handling large data – Works across multiple servers and systems.
✔️ Turning data into insights – Creates real-time dashboards for monitoring and decision-making.
Elasticsearch vs. Traditional RDBMS: A Developer’s Perspective
If you're used to working with relational databases like MySQL or PostgreSQL, switching to Elasticsearch might feel like stepping into a whole new world. But Elasticsearch is just another way to store, retrieve, and search data—the difference is in how it’s structured and optimized.
Instead of tables and rows, Elasticsearch works with documents and indices. Let’s break it down using concepts you already know.
Thinking in Tables vs. Thinking in Documents
| RDBMS Concept | Elasticsearch Equivalent |
|---|---|
| Database | Index |
| Table | Type (deprecated in newer versions) |
| Row | Document |
| Column | Field |
| Schema | Mapping |
In relational databases, data is neatly organized into tables with predefined schemas—every row must follow a fixed structure.
Elasticsearch, on the other hand, is schema-less (to an extent). Instead of rows, it stores JSON documents inside an index (similar to a table). Each document can have a flexible structure, making it great for semi-structured or dynamic data.
How Data is Stored: Rows vs. JSON Documents
🔹 RDBMS Example (Users Table in MySQL)
Here’s how you’d define a simple users table in MySQL:
CREATE TABLE users (
    id INT PRIMARY KEY,
    name VARCHAR(100),
    email VARCHAR(100),
    age INT
);
🔹 Elasticsearch Equivalent (JSON Document in an Index)
In Elasticsearch, each user record is stored as a JSON document inside an index:
json
{
    "id": 1,
    "name": "Jane Doe",
    "email": "jane.doe@example.com",
    "age": 30
}
Instead of inserting data as rows, Elasticsearch stores each entry as a self-contained JSON document. This structure allows for fast searching and flexible querying without requiring rigid table schemas.
Querying: SQL vs. Elasticsearch Query DSL
One of the biggest differences between RDBMS and Elasticsearch is how you search for data.
Traditional databases use SQL, while Elasticsearch has its own Query DSL (Domain-Specific Language), which is JSON-based.
🔹 Finding all users aged 30 in MySQL (SQL Query)
SELECT * FROM users WHERE age = 30;
🔹 Finding all users aged 30 in Elasticsearch (Query DSL)
json
{
    "query": {
        "match": {
            "age": 30
        }
    }
}
Elasticsearch
Fast Search & Distributed Indexing
At the core of the ELK Stack is Elasticsearch, a highly scalable, distributed search engine that enables rapid data access retrieval. Unlike traditional databases that are optimized for structured data and transactions, Elasticsearch is designed for:
- Full-text search – Finds relevant results instantly, even in massive datasets.
- Real-time indexing – New data becomes searchable almost immediately.
- Scalability – Distributes data across multiple nodes to handle petabytes of information.
It’s built on Apache Lucene, a powerful search library, and uses an inverted index, a structure specifically optimized for search queries.
How Elasticsearch Works
1️⃣ Indices & Documents – The Building Blocks
Elasticsearch doesn’t use tables and rows like a relational database. Instead, it stores data as JSON documents inside an index.
🔹 Think of an index like a database, and each document inside it as a record. Unlike relational databases, these documents can have different structures—offering flexibility for handling dynamic or semi-structured data.
2️⃣ Shards & Replicas – How Elasticsearch Scales
Handling massive amounts of data requires scalability, and that’s where sharding and replication come in.
- Shards: Elasticsearch splits an index into smaller pieces (shards) to distribute data across multiple nodes.
- Replicas: Each shard can have replicas—copies stored across different nodes to improve redundancy and performance.
This architecture makes Elasticsearch both fault-tolerant and lightning fast, even when dealing with billions of records.
Why Elasticsearch is Powerful for Log Analysis
Imagine you’re managing a cloud-based web application that logs thousands of events every second. A typical log entry might look like this:
{
    "timestamp": "2025-03-24T12:34:56Z",
    "level": "ERROR",
    "message": "Database connection failed",
    "service": "authentication",
    "user_id": 1234
}
Once indexed in Elasticsearch, you can instantly search for all error messages related to the authentication service:
{
    "query": {
        "match": {
            "service": "authentication"
        }
    }
}
This makes Elasticsearch incredibly powerful for log analysis, large-scale search applications, and real-time data insights.
Logstash – The Data Pipeline
Collecting, Transforming, and Shipping Data
While Elasticsearch is great for searching and analyzing data, it doesn’t collect or process data on its own. That’s where Logstash comes in.
Logstash acts as a data pipeline that:
1️⃣ Collects data from multiple sources (logs, databases, cloud services).
2️⃣ Transforms it into a structured format (parsing, filtering, masking sensitive data).
3️⃣ Sends it to Elasticsearch (or other destinations like Kafka).
How Logstash Works
Logstash follows a simple ETL (Extract, Transform, Load) workflow.
1️⃣ Input – Collecting Data
Logstash gathers logs from multiple sources:
✅ Files – System logs, application logs, web server logs.
✅ Databases – MySQL, PostgreSQL, MongoDB.
✅ Cloud Services – AWS CloudWatch, Google Cloud Logs.
Example: Collecting Logs from a File
input {
  file {
    path => "/var/log/syslog"
    start_position => "beginning"
  }
}
2️⃣ Filter – Transforming & Enriching Data
Before sending data to Elasticsearch, Logstash can clean, modify, and enrich logs.
✅ Parse JSON logs for better searchability.
✅ Mask sensitive data like passwords.
✅ Geo-location enrichment (find a user’s country based on IP).
Example: Masking Passwords in Logs
filter {
  json {
    source => "message"
  }
  mutate {
    gsub => ["password", ".*", "[REDACTED]"]
  }
}
3️⃣ Output – Sending Data to Elasticsearch
After processing, Logstash ships logs to Elasticsearch.
Example: Indexing logs in Elasticsearch
output {
  elasticsearch {
    hosts => ["http://localhost:9200"]
    index => "logs-%{+YYYY.MM.dd}"
  }
}
This automates log ingestion and ensures that logs are structured, searchable, and ready for analysis in Kibana.
Kibana – Bringing Data to Life
Dashboards, Analytics, and Insights
Now that our logs are in Elasticsearch, how do we make sense of all this data? Kibana makes it visual and interactive.
Kibana is a dashboard and analytics tool that allows you to:
✅ Monitor logs and metrics in real-time.
✅ Run searches and filter data with ease.
✅ Set up alerts for anomalies or critical issues.
Key Features of Kibana
1️⃣ Dashboards & Visualizations
Kibana lets you build custom dashboards using bar charts, line graphs, pie charts, and heatmaps.
- See server performance trends over time.
- Track error rates in real time.
- Visualize traffic spikes on your website.
2️⃣ Discover & Search
Kibana’s search interface helps drill down into logs.
For example, you can filter logs to show only:
✔️ ERROR messages from a specific service
✔️ API requests made by a certain user
✔️ Security alerts from a particular IP range
3️⃣ Spotting Patterns & Trends with Kibana
Kibana makes it easy to spot patterns in your data over time. With simple tools like Timelion and Lens, you can:
See sudden jumps in website visitors and understand why.
Connect system crashes to specific events to troubleshoot faster.
Identify trends in user activity to improve your services.
Conclusion
The ELK Stack—Elasticsearch, Logstash, and Kibana, turns raw logs into searchable, visual insights for better monitoring and decision-making. Elasticsearch handles fast searches, Logstash collects and processes data, and Kibana brings it to life with dashboards. Together, they power real-time analytics for DevOps, security, and business intelligence.
Next, we’ll deploy ELK on AWS, covering setup, scaling, and optimization. Stay tuned for the hands-on guide! 🚀

Top comments (0)