
Charts are everywhere, turning boring facts & numbers into beautiful graphs.
Helps us digest information easily with stunning-visualization.
Nowadays, we can create charts easily with common spreadsheet programs like Libre Office or Micro$oft Office.
How about web?
Say you want to present information for your web visitor with interactive data visualization.
Well, there are tons of cool charting libraries available to create eye-pleasing charts.
In this post I want to share how to create a database-driven chart with ChartJS.
ChartJS is an open source HTML5 & Javascript charting libraries. Official web: https://chartjs.org
This will be helpful for beginner that wanted to know how to generate chart with data from database.
We also will be able to update our chart data with a date picker.
The output of this project will be like this:
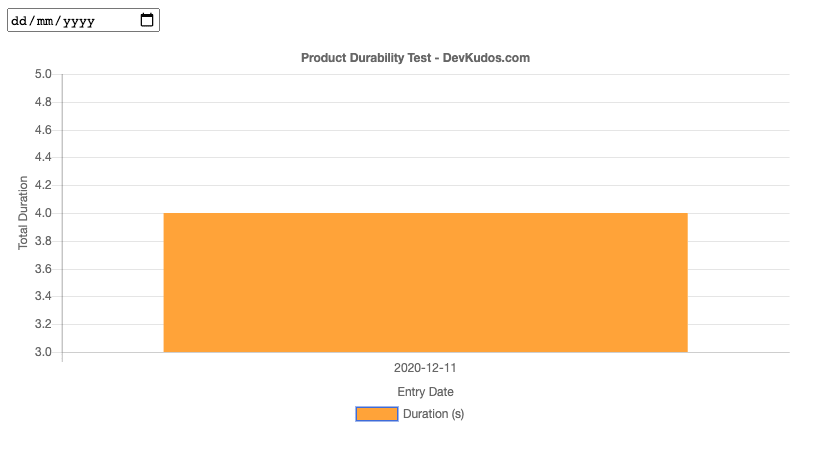
Feel free to check this live demo:
https://bit.ly/3gVUKe3
You can download complete code here:
https://bit.ly/3gXhjz2
For this project we will use:
Apache version 2.4.34
PHP version 7.3.8
MariaDB version 10.4.8
ChartJS version 2.6.0
So let's get started:
1.Make sure you already installed Apache, PHP & MariaDB. If you haven't and want simplicity I suggest you to install XAMPP.
2.Use any database manager tool you love, GUI like PHPMyAdmin or console based tools.
3.We need to create the database, let's call it charty
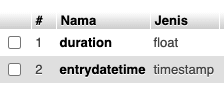
4.Then create one table, name it chart
5.This table have two fields, duration (float) and entrydatetime (timestamp)
6.After you finished with database stuff, we can proceed to coding phase
7.Launch your favourite IDE or Code Editor, I'm using Visual Studio Code.
8.Create charty folder inside your web directory, if you installed XAMPP then it'll be ../htdocs/charty, if you install Apache separately then it will be ../www/charty. If you don't know where to locate it, please check the documentation
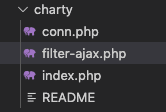
9.This is the complete folder structure
10.Create conn.php for database configuration, place this code inside it
<?php
// Charty Database Configuration
$db_name = "charty";
$username = "root";
$password = "";
$servename = "localhost";
$conn = mysqli_connect($servename ,$username ,$password ,$db_name );
        mysqli_set_charset($conn ,"utf-8");
11.Next, create index.php for our main chart generator code, place this code inside it. This file consists of several parts:
The first part, PHP code that include conn.php.
We also place our query here.
As you realize, this is not best practices.
I wrote like this for tutorial simplicity:
<?php
require "conn.php";

$result = array();
$result['duration'] = '';
$result['entrydatetime'] = '';

$sql = "SELECT  SUM(duration) as duration,
                DATE(entrydatetime) as entrydatetime
        FROM `chart`
        GROUP BY DATE(entrydatetime)
        LIMIT 0, 1";
$query_result = mysqli_query($conn, $sql);

// Loop the query result
while($row = mysqli_fetch_array($query_result))
{
        $result['duration']       = $row[0];
        $result['entrydatetime']  = $row[1];
}
        mysqli_close($conn);
?>
The second part, we need to create placeholder for our chart, perfectly served by HTML5 div tag.
The datepicker element also written in pure HTML5 tag.
<div class='chart' style='width:100%'>
   <input type='date' onfocus='(this.type="date")' onchange='callAjax()' placeholder='entrydatetime'
   id='start'>
   <canvas id='myChart' width='400' height='200'></canvas>
</div>
The last part, combination of Javascript and PHP code:
We load Chart.js library from cdn.
And we convert query result from previous section into javascript variable.
The dt & lbls variables are required by chart.js lib to store chart data points.
<script src='https://cdnjs.cloudflare.com/ajax/libs/Chart.js/2.6.0/Chart.js'></script>
<script type='text/javascript'>
<?php
echo "var dt = ['". $result['duration'] . "'];";
echo "var lbls = ['". $result['entrydatetime'] . "'];";
?>

var ctx = document.getElementById('myChart').getContext('2d');
var chart = new Chart(ctx, {
  type: 'bar',

  // The data for our dataset
  data: {
    labels: lbls,
    // Information about the dataset
    datasets: [{
      label: "Duration (s)",
      backgroundColor: 'orange',
      borderColor: 'royalblue',
      data: dt,
    }]
  },

  // Configuration options
  options: {
    layout: {
      padding: 10,
    },
    legend: {
      position: 'bottom',
    },
    title: {
      display: true,
      text: "Product Durability Test - DevKudos.com"
    },
    scales: {
      yAxes: [{
        scaleLabel: {
          display: true,
          labelString: 'Total Duration'
        }
      }],
      xAxes: [{
        scaleLabel: {
          display: true,
          labelString: 'Entry Date'
        }
      }]
    }
  }
});
And the callAjax() function is used to do the AJAX call when datepicker changes.
// This function will call filter-ajax.php with selected date to retrieve data
function callAjax(){
    var start = document.getElementById("start").value
    var xhr = new XMLHttpRequest();
    var url = "http://localhost/charty/filter-ajax.php?date=" + start;
    xhr.onreadystatechange = function(){
        if(this.readyState == 4 && this.status == 200){
            response = JSON.parse(this.responseText)
            chart.data.datasets[0].data[0] = response.duration;
            chart.data.labels[0] = response.entrydatetime;
            chart.update();
        }
    };
    xhr.open("GET", url, true);
    xhr.send();
}
</script>
The complete code for index.php
<?php
require "conn.php";

$result = array();
$result['duration'] = '';
$result['entrydatetime'] = '';

$sql = "SELECT  SUM(duration) as duration,
                DATE(entrydatetime) as entrydatetime
        FROM `chart`
        GROUP BY DATE(entrydatetime)
        LIMIT 0, 1";
$query_result = mysqli_query($conn, $sql);

// Loop the query result
while($row = mysqli_fetch_array($query_result))
{
        $result['duration']       = $row[0];
        $result['entrydatetime']  = $row[1];
}
        mysqli_close($conn);
?>

<div class='chart' style='width:100%'>
   <input type='date' onfocus='(this.type="date")' onchange='callAjax()' placeholder='entrydatetime'
   id='start'>
   <canvas id='myChart' width='400' height='200'></canvas>
</div>

<script src='https://cdnjs.cloudflare.com/ajax/libs/Chart.js/2.6.0/Chart.js'></script>
<script type='text/javascript'>
<?php
echo "var dt = ['". $result['duration'] . "'];";
echo "var lbls = ['". $result['entrydatetime'] . "'];";
?>

var ctx = document.getElementById('myChart').getContext('2d');
var chart = new Chart(ctx, {
  type: 'bar',

  // The data for our dataset
  data: {
    labels: lbls,
    // Information about the dataset
    datasets: [{
      label: "Duration (s)",
      backgroundColor: 'orange',
      borderColor: 'royalblue',
      data: dt,
    }]
  },

  // Configuration options
  options: {
    layout: {
      padding: 10,
    },
    legend: {
      position: 'bottom',
    },
    title: {
      display: true,
      text: "Product Durability Test - DevKudos.com"
    },
    scales: {
      yAxes: [{
        scaleLabel: {
          display: true,
          labelString: 'Total Duration'
        }
      }],
      xAxes: [{
        scaleLabel: {
          display: true,
          labelString: 'Entry Date'
        }
      }]
    }
  }
});

// This function will call filter-ajax.php with selected date to retrieve data
function callAjax(){
    var start = document.getElementById("start").value
    var xhr = new XMLHttpRequest();
    var url = "http://localhost/charty/filter-ajax.php?date=" + start;
    xhr.onreadystatechange = function(){
        if(this.readyState == 4 && this.status == 200){
            response = JSON.parse(this.responseText)
            chart.data.datasets[0].data[0] = response.duration;
            chart.data.labels[0] = response.entrydatetime;
            chart.update();
        }
    };
    xhr.open("GET", url, true);
    xhr.send();
}
</script>
12.Create filter-ajax.php, this will be called when we update datepicker. Then will return data in JSON format.
<?php
// Ensure the response will be send as json format, otherwise error will arise
header('Content-Type: application/json');
require "conn.php";

$date = $_GET['date'];
$result = array();
$result['duration'] = '';
$result['entrydatetime'] = '';

$sql = "SELECT  SUM(duration) as duration,
                DATE(entrydatetime) as entrydatetime
        FROM `chart`
        WHERE DATE(entrydatetime) = '$date'
        GROUP BY DATE(entrydatetime) LIMIT 0, 1";

$query_result = mysqli_query($conn, $sql);

while($row = mysqli_fetch_array($query_result))
{
        $result['duration'] = $row[0];
        $result['entrydatetime'] = $row[1];
}
        echo json_encode($result);
        mysqli_close($conn);
?>
13.Finally we're ready test our chart, fire-up your favourite web browser, and visit http://localhost/charty
That's it
Just kind reminder, you can test the live result here:
https://bit.ly/3gVUKe3
And download the source code here:
https://bit.ly/3gXhjz2
I hope you enjoy this tutorial, please like & share if you find this helpful.
If you have any questions or interesting project, feel free to poke me at akbar@devkudos.com or visit my web: https://devkudos.com
Ila liqo

Top comments (0)