Problem description
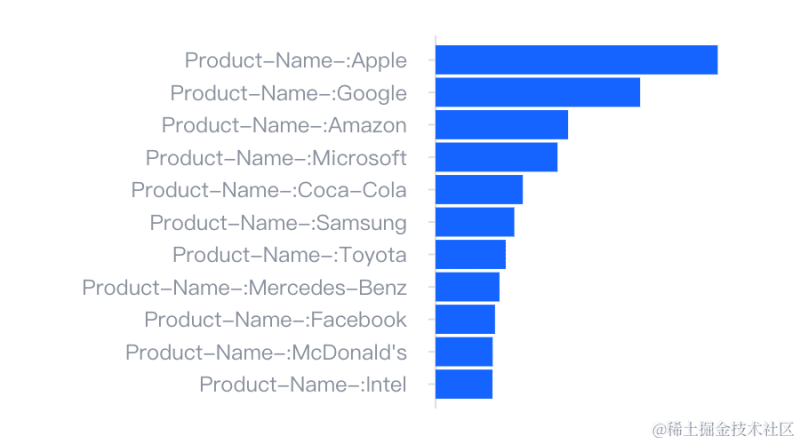
The axis text labels in the chart are relatively long. I hope to increase the axis width to display more text. How should I configure it?

Solution
You can configure axes.width to set the width of the axis component.
-
Width: '50%': Configure the percentage string, which represents that the component width accounts for half of the chart during layout
  axes: [
    {
      orient: 'left',
      width: `50%`
    }
  ],
-
Width: 100: Configure a fixed value, representing the pixel width of the component width during layout
Code example
const spec = {
  type: 'bar',
  width:450,
  height: 250,
  data: [
    {
      id: 'barData',
      values: [
    {
        "name": "Product-Name-:Apple",
        "value": 214480
    },
    {
        "name": "Product-Name-:Google",
        "value": 155506
    },
    {
        "name": "Product-Name-:Amazon",
        "value": 100764
    },
    {
        "name": "Product-Name-:Microsoft",
        "value": 92715
    },
    {
        "name": "Product-Name-:Coca-Cola",
        "value": 66341
    },
    {
        "name": "Product-Name-:Samsung",
        "value": 59890
    },
    {
        "name": "Product-Name-:Toyota",
        "value": 53404
    },
    {
        "name": "Product-Name-:Mercedes-Benz",
        "value": 48601
    },
    {
        "name": "Product-Name-:Facebook",
        "value": 45168
    },
    {
        "name": "Product-Name-:McDonald's",
        "value": 43417
    },
    {
        "name": "Product-Name-:Intel",
        "value": 43293
    },

]
    }
  ],
  direction: 'horizontal',
  xField: 'value',
  yField: 'name',
  axes: [
    {
      orient: 'bottom',
      visible: false
    },
    {
      orient: 'left',
      width: `50%`
    }
  ],
  label: {
  }
};

const vchart = new VChart(spec, { dom: CONTAINER_ID });
vchart.renderSync();

// Just for the convenience of console debugging, DO NOT COPY!
window['vchart'] = vchart;

Top comments (0)