If JavaScript is single-threaded then running this code with one core or with several should make no difference, or should it?
const syntheticOp = ({ a, b }) => {
    let res = [];
    for (let i = 0; i < 200000 ; i++) {
        res[i] = { val: a * b * BigInt(i) };
    }
    return res;
};

function main(){
    for (let i = 0; i < 100; i++) {
        syntheticOp({
            a: BigInt(Math.floor(Math.random() * 1000)),
            b: BigInt(Math.floor(Math.random() * 1000)),
        });
    }
}
main();
Let's run it with one core taskset -c 15 node --inspect-brk synthetic.js and profile it.

The whole operation took over 7 seconds and most of the time (60%) of the time was taken by garbage collection pauses, now we run it with 4 cores taskset -c 12,13,14,15 node --inspect-brk synthetic.js and see what the profiler tells us.
Hmm, fascinating, why is the 4 cores execution near 2x faster than the single core execution?, and why the speed up is mostly on the garbage collector, that no longer takes most of the execution time? well, we do know why; Java-script is single-threaded, its garbage collector is not , see V8's Orinoco, so the performance gain is on the back of the garbage collector, this is great isn't?, it is, as long as the developer is counting on deploying its application on a multi-threaded environment, and we rarely do.
The more objects we allocate, the more GC will take time to collect, slowing down our application/program, effectively turning object allocations into a processing power loan that have to pay back on the GC pauses, somewhat of an oversimplification, but good enough to understand the price we pay for memory allocation.
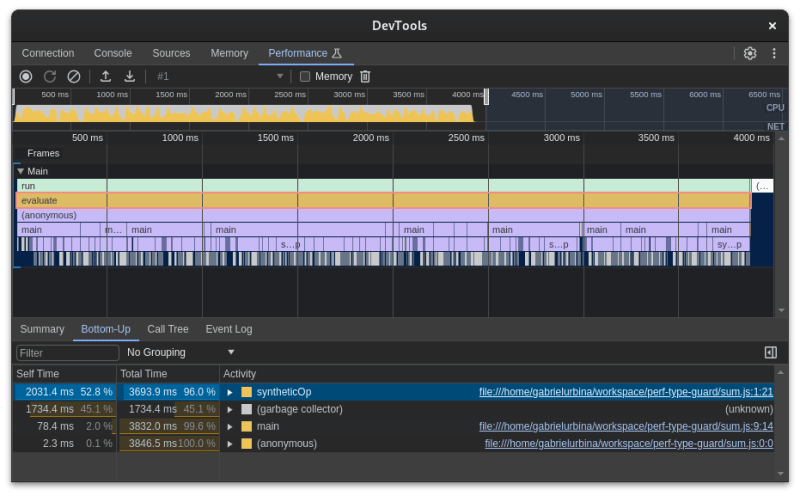
You might be interested on a concrete case, not just a synthetic test, so lets take a look at my library type-guard on version version 0.2.2, benchmark it with large objects and inspect memory and execution profiles.
import {
    ObjectOf, isString, isNumber, ArrayOf
} from "@gabrielurbina/type-guard";

const persons = Array.from({ length: 100000 }, () => ({
    firstName: Math.random().toString(36).slice(2),
    lastName: Math.random().toString(36).slice(2),
    age: Math.floor(Math.random() * 100),
}));

const isPersons = ArrayOf([
    ObjectOf({
        firstName: isString,
        lastName: isString,
        age: isNumber,
    }),
]);

function main() {
    for (let i = 0; i < 100; i++) {
        isPersons(persons);
    }
}

main();

1.4% of GC usage is great, isn't,well it could be better, let's have a look at how much memory are we creating here
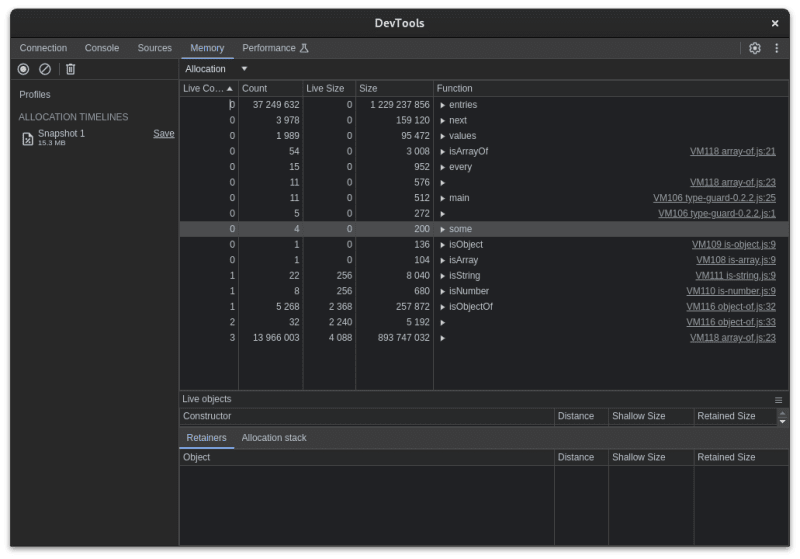
Wow, we are creating a few millions objects during the execution of this benchmark, that can definitely be improved, and I already did on version version 0.2.3 where I dropped all temporally allocated objects, and if we inspect the same metrics for this version you might be surprised.

During the execution of the benchmark, there was no GC pause, which is phenomenal, also this version is close to 2x faster, but how about the memory usage?

Now we are talking, I managed to reduce the memory usage from few millions objects to near a hundred objects, also to have a constant memory usage over time, after initialization, the memory usage does not increase, making this library perfectly suitable for running on single-core applications and for indefinitely long processes.
Buy why, why does it matter, these are just some extra ms of runtime and some extra Megabytes of memory? Because I just want to ship non-pessimized code, I also recognize that the state of the JavaScript ecosystem performance is as poor as it is, not because one single master library, but because each ms and MB not optimized adds up to our already sluggish ecosystem.

Top comments (0)