How to Detect Low Test Coverage Files in Jest (JavaScript/TypeScript)
Through observing our customers' behavior, we've noticed a common challenge when teams want to improve their test coverage: identifying which files to tackle first. Without a clear overview of low-coverage files, developers often resort to randomly selecting files or relying on gut feelings. This initial hurdle of "where do we even start?" can significantly slow down or even halt test coverage initiatives, often leading teams to abandon the task entirely.
That's why we're introducing this coverage dashboard. It provides an instant, clear view of which files need attention, eliminating the guesswork from test coverage improvement. In this guide, we'll show you how to set up automated test coverage reporting for your Jest (JavaScript/TypeScript) project and use GitAuto to improve coverage systematically.
TL;DR - What's the story?
- Prerequisites
- Setting Up GitHub Actions
- Viewing Coverage Reports
- Creating Issues for Low Coverage
- Automating Coverage Improvement
1. Prerequisites
Before we begin, ensure you have:
- A JavaScript/TypeScript project with Jest hosted on GitHub
- GitHub Actions enabled in your repository
- GitAuto installed in your repository
2. Setting Up GitHub Actions
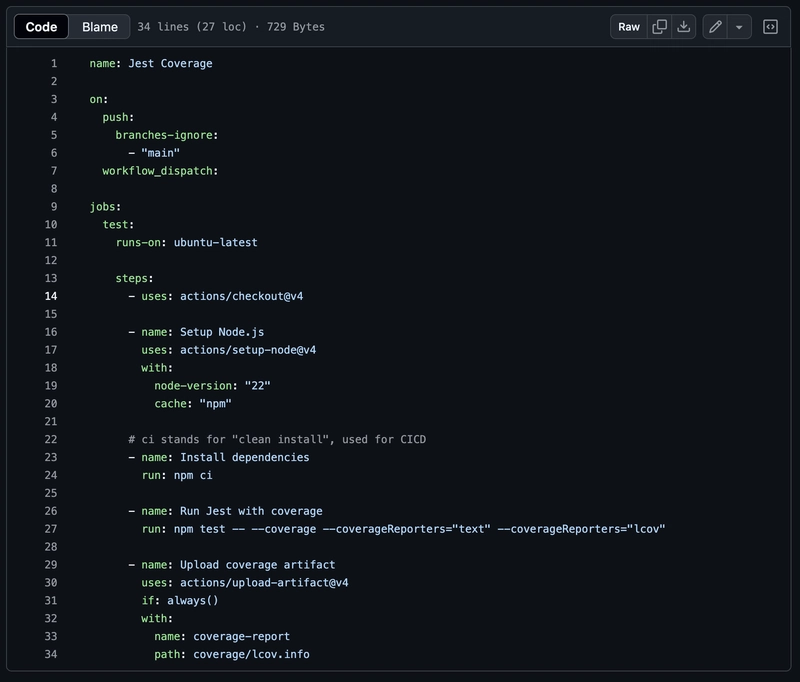
First, let's set up GitHub Actions to run tests and generate coverage reports. Create a workflow file in your .github/workflows/ directory (the file name can be anything, but we'll use jest.yml in this example):
Key points in this configuration:
-
jest --coverage --coverageReporters="lcov"generates the coverage report- The
--coverageReporters="text"flag is optional but useful for seeing coverage summary in the console and GitHub Actions logs - If your
package.jsonhas"test": "jest", you can also usenpm test -- --coverage --coverageReporters="lcov".--is used to pass flags to thejestcommand from npm
- The
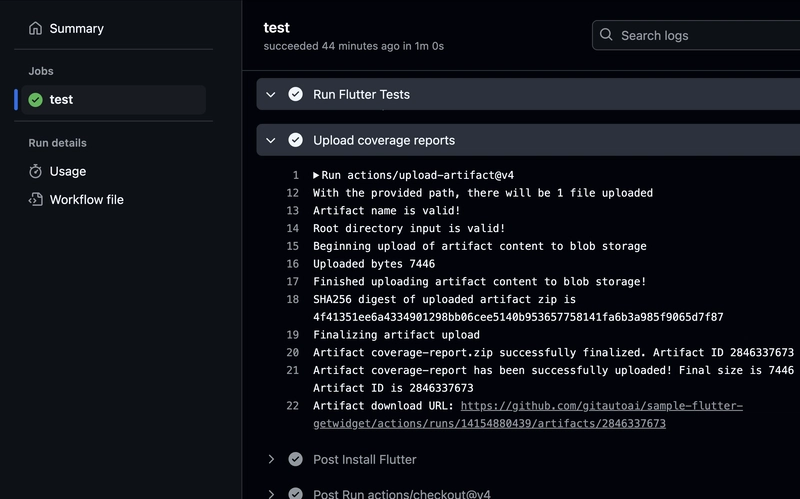
- The report is uploaded as an artifact named
coverage-report(any name containing "coverage" is fine) - We specify the exact file path
coverage/lcov.infoto upload only this file (don't change the file name or upload the entire directory)
3. Viewing Coverage Reports
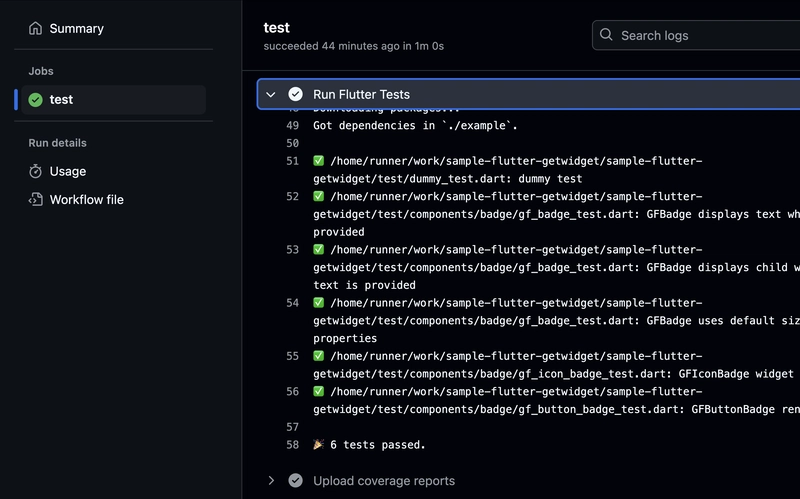
Once your workflow runs successfully:
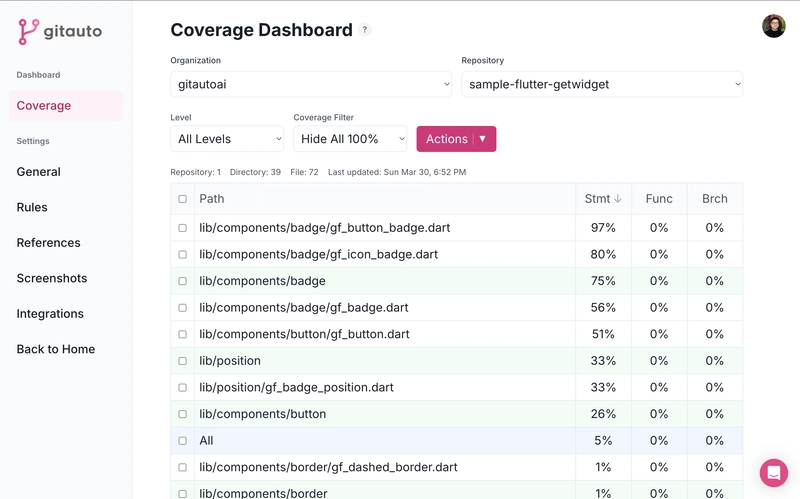
GitAuto will automatically process the coverage reports here:
The coverage data updates automatically whenever your GitHub Actions workflow runs. In this example configuration, that happens when:
- You push to any branch except master (e.g., when pushing your feature branch for a pull request)
- You push additional commits to an existing pull request
- You manually trigger the workflow from the GitHub Actions page using "workflow_dispatch"
This ensures you always see the latest coverage information as your code evolves.
4. Creating Issues for Low Coverage
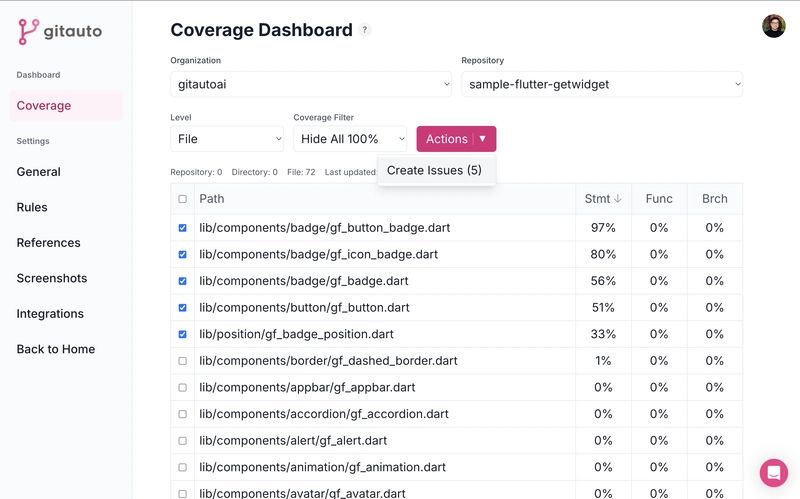
From the coverage dashboard, you can:
- View files with low test coverage
- Create GitHub issues for specific files
- Assign issues to GitAuto for automated improvement
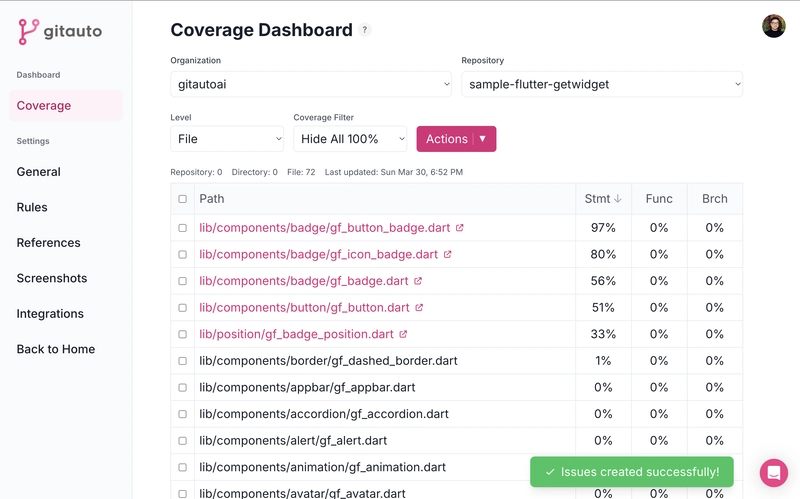
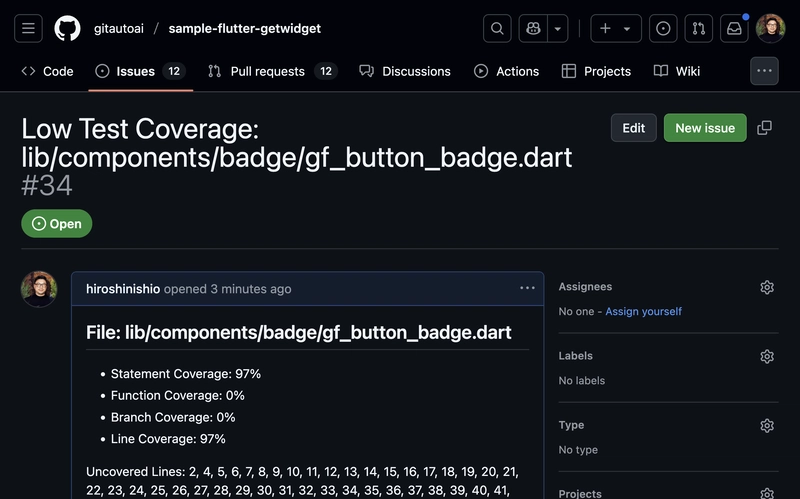
After issues are created, the file names become clickable links. Clicking these links takes you to the corresponding GitHub issues:
You can create issues either:
- One by one for targeted improvement
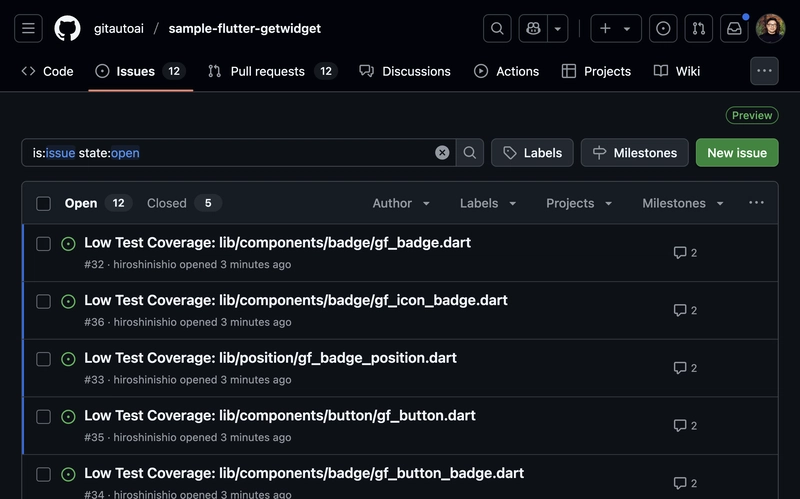
- In bulk for systematic coverage enhancement
Theoretically, you could create issues for all low-coverage files at once and have GitAuto generate pull requests for all of them simultaneously. While this would consume a significant number of credits, it means you could potentially improve your test coverage from 0% to nearly 100% in a single day - just be mindful of your credit usage!
5. Automating Coverage Improvement
After creating issues and assigning them to GitAuto, GitAuto will:
- Analyze the code in files with low coverage
- Create pull requests with appropriate test cases
- Run the tests to verify coverage improvement
Each time the workflow runs, new coverage data is collected and processed, allowing you to track improvements over time.
Next Steps
Now that you have automated coverage reporting set up, you can:
- Monitor coverage trends over time
- Identify critical areas needing testing
- Let GitAuto handle the creation of test cases
- Review and merge the generated test cases
For more examples of how GitAuto can help with testing, check out our guides on adding unit tests and widget tests.
Questions or feedback? Contact us at info@gitauto.com.




Top comments (0)