

Originally published on my Substack.
Prompt caching on Amazon Bedrock can stop working without a single error. I run a platform of Claude agents on Bedrock, and I went through this quarter’s bug reports about Bedrock caching in the big agent frameworks. Five failures kept coming back. For each one: what happens, how to tell if it is happening to you, and what to change.
In July, a LiteLLM upgrade changed where the system prompt went in Bedrock requests. Cache hits on Claude Code traffic fell from about 90% to 25-45%, and daily spend went up 2-3x for six days before anyone traced it. Every request returned 200. AWS documents the caching rules, but the one that bites agents hardest, how far back Bedrock looks for an earlier cache entry, is given only as “approximately 20 content blocks”. So I measured it.
If this is new to you
Datadog found that in March 2026, 69% of all input tokens in its customers’ traces were system prompts: instructions, policies and tool guidance sent again on every call. Prompt caching is what keeps that cheap. Bedrock can reuse the start of a request, meaning your instructions, tool list and earlier conversation, and bill it at about a tenth of the normal input price.
You mark where the reusable part ends with a cache point. The next request reuses it only if everything before that point is exactly the same, and only if Bedrock can find the earlier entry. When either fails, the request still works. You just pay full price again, plus a 25% premium to write the cache a second time.
The five are ordered roughly the way an agent meets them: first where the cache point sits, then what a busy turn does to it, then the prompt itself, the library that builds it, and the stream that rebuilds it.
1. Move the cache point forward in agent loops
In an agent loop, most new tokens are tool calls and tool results, not user messages. If the cache point only goes on the last user message, it stays on the first prompt while the tool history grows behind it. Every call then pays full price for that history.
This is what happened in Cline 4.1.0. Its Bedrock code put the cache point on the last message with the role “user”, and in its message format tool results have their own role. So the point never moved past the opening prompt. Users saw one cache write at the start of each session and none after (cline/cline#13738; 4.0.12 was fine).
The test: in a long agent session, cache reads should grow call by call. If they stop growing while input tokens keep climbing, the point isn’t moving. The fix is to put the cache point on the last block of the newest message, whatever its role.
2. Add a second cache point after wide tool fan-outs
When Bedrock looks for an earlier cache entry, it only searches back a fixed number of content blocks from the new cache point. I measured the edge: with 21 blocks added since the old cache point the next request still hit, and with 22 it missed, every time. Every tool call and every tool result is a block. So one turn with ten or more parallel tool calls can push the old entry out of reach.
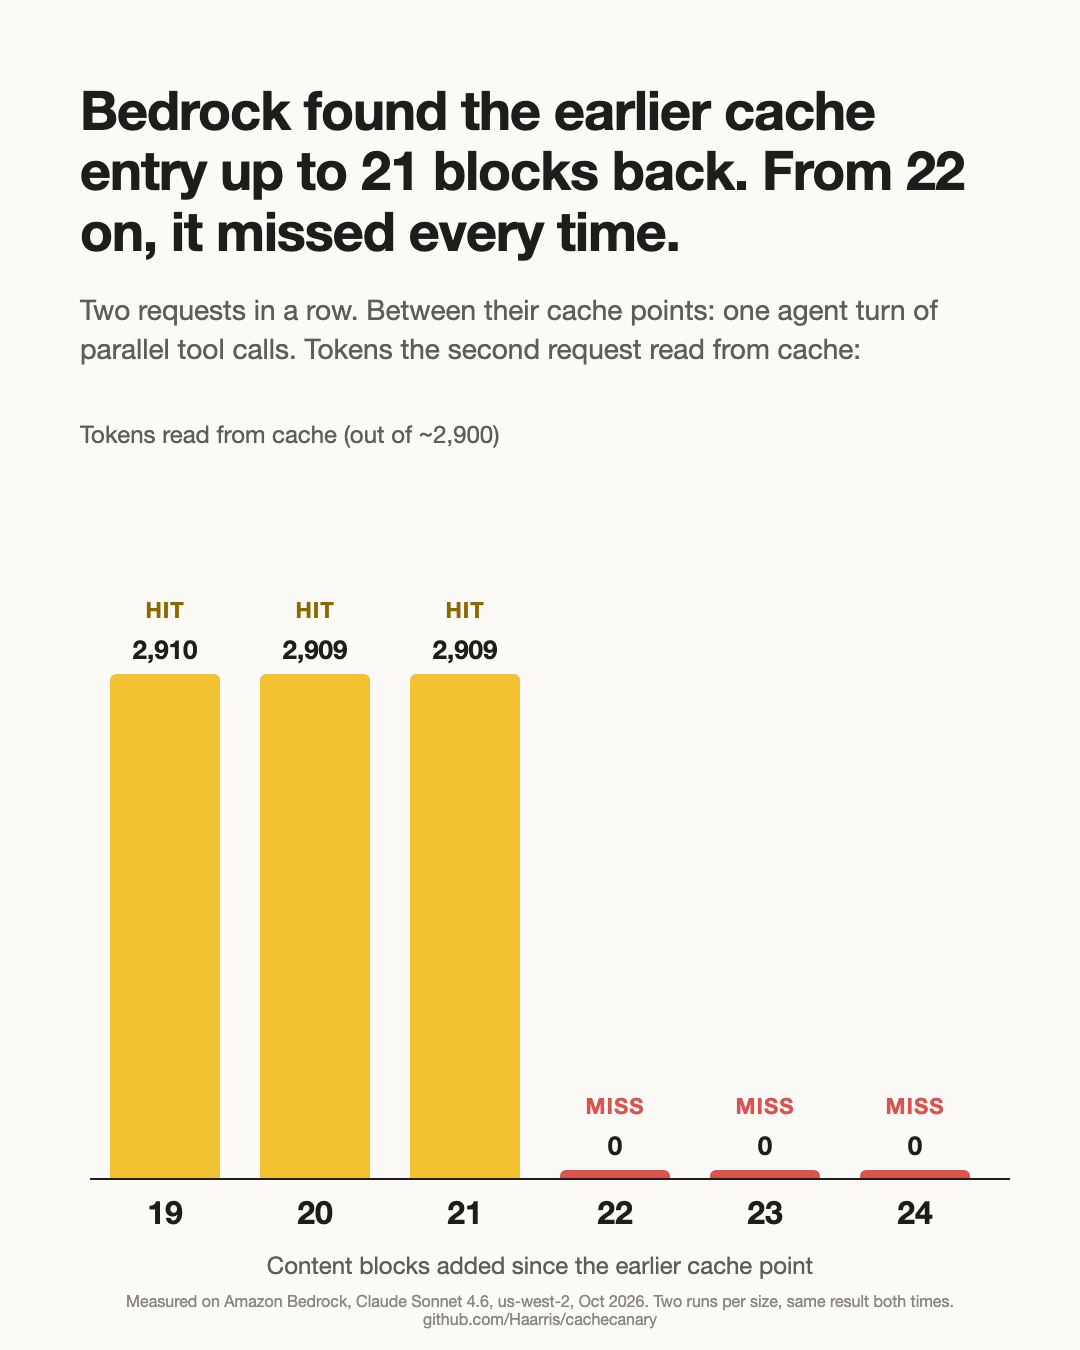
pydantic-ai saw the same edge in its own tests. After 10 parallel calls (21 new blocks) the next request read 6,827 tokens from cache. After 11 calls (23 blocks) it read 0 and wrote 7,534 again (pydantic/pydantic-ai#9404). A Strands user saw an 18-call turn followed by 0 tokens read and 134,082 written (strands-agents/harness-sdk#3348). The same requests on Anthropic’s own API didn’t miss, because there a run of tool calls counts as one position. Bedrock counts each one.
The test: look at the calls right after your widest turns. A read of zero there, with normal reads elsewhere, is this. The fix: keep the previous cache point when a turn added more than about 18 blocks. Bedrock allows four cache points per request, so there is usually room.
3. Keep anything that changes per request after the cache point
Caching is a prefix match. A date, a request ID, a user’s name or a per-item instruction placed before the cache point makes every request unique, so every call writes the cache and none read it.
An AWS sample app showed it cleanly. Over 28 calls reviewing the same document, CloudWatch recorded 196,680 tokens written to cache and 0 read, because the cache point was placed after each item’s own instructions. Moving it to right after the document turned the second item into a 4,624-token read (aws-samples/review-and-assessment-powered-by-intelligent-documentation#327). Subtler versions exist too. In one Mastra setup, storing messages in a Postgres jsonb column changed the order of attribute keys on the way back, which changed the prompt bytes and broke the cache (mastra-ai/mastra#25929).
The test: run the same request twice and compare the bytes up to the cache point. They have to be identical. The fix is to put dynamic text after the last cache point, and to serialize anything structured in a stable order.
4. Check your library still sends the cache point
Most teams don’t write cache points by hand. A framework or gateway adds them, often only for model IDs it recognises. Upgrade the library, switch to a new model ID or an application inference profile ARN, and the cache point can quietly disappear.
That’s the LiteLLM incident above. It isn’t rare: MLflow’s AI Gateway turns Bedrock chat messages into plain strings and never sends a cache point at all (mlflow/mlflow#26477), and LangChain’s openwiki found its caching middleware skipped application inference profile ARNs (langchain-ai/openwiki#853).
The test: if cache reads and cache writes are both zero, no cache point is reaching Bedrock. Check this after every library upgrade and every model change.
5. Watch how streaming rebuilds the message
When you stream a response and save it back into the conversation, your library rebuilds the assistant message from the chunks. If it rebuilds it differently than one piece of text, the history changes shape.
In LangChain.js, streaming with extended thinking on Bedrock dropped the block index on text chunks, so one answer was saved as hundreds of separate text blocks. That pushed the next cache point far past the lookback limit (langchain-ai/langchainjs#11357).
The test: count the content blocks in a saved assistant message. One reply should be one text block, not hundreds.
Checking your own account
Two CloudWatch metrics in the AWS/Bedrock namespace tell you most of it: CacheReadInputTokenCount and CacheWriteInputTokenCount, split by model ID. In steady traffic, reads should be many times writes. Writes with reads near zero means caching is on but missing, which costs more than not caching at all. Both near zero means no cache point is being sent.
If the hit rate dips at busy times while the prompts stay identical, look at cross-region inference. AWS notes that at times of high demand its routing “may lead to increased cache writes”, because a request can land in a Region that doesn’t hold the cached copy.
For the why, turn on Bedrock model invocation logging. The logs carry the cache counts for every call and who made it.
What I would still like
Two things. Cache diagnostics on Bedrock: Anthropic’s Console now explains why a request missed the cache, and Bedrock doesn’t. And an exact lookback number in the AWS docs instead of “approximately 20”, since one tool call more or less decides whether an agent pays 0.1x or 1.25x for its history.
Sources and disclosure
The lookback numbers are my own measurement: two requests per size on Amazon Bedrock, Claude Sonnet 4.6, us-west-2, October 2026, run twice each with fresh prompts so an old cache entry could not fake a hit (scripts/live_lookback_boundary.py in the CacheCanary repo). Prices and multipliers are AWS’s published on-demand rates. The other numbers come from LiteLLM’s incident write-up (docs.litellm.ai/blog/bedrock-invoke-prompt-caching-incident); Datadog, “Monitor prompt caching to optimize your token usage” (September 2026); Anthropic, “Reducing cost and improving performance with Claude Platform” (September 2026); the AWS Bedrock prompt caching docs; and the public GitHub issues linked in each section.
I build the agent platform at Ruby AI, which runs Claude on Bedrock. I also made a small free tool for the checks above, CacheCanary (github.com/Haarris/cachecanary). It reads invocation logs and shows hit rate and what the misses cost, and it compares two saved requests to tell you why the second one missed. Since this post I've also written tested guides for LiteLLM, Strands Agents and LangChain that show exactly what each one sends to Bedrock and where the cache is lost.
I write these when something breaks in production and the docs did not warn me. The next one goes out first on my Substack.


Top comments (0)