
Recently, I tried to load techan.js (http://techanjs.org/) in a Jupyter notebook javascript kernel. However, it failed to load since techan.js is made in commonJS format. Jupyter javascript kernel inherently uses requirejs(https://requirejs.org/) which support es6 based modules.
One of good PRs is https://github.com/andredumas/techan.js/pull/220 which converts the current commonJS system to ES6 module system. Therefore, I cloned it and changed some codes in order to be compatible with requirejs.
The output of the above cell is the cover image.
In addition, I noted how to embed amcharts(https://www.amcharts.com/) which is quite useful for visualization in Jupyter notebook as well.
The output of the amChart cell in Jupyter:
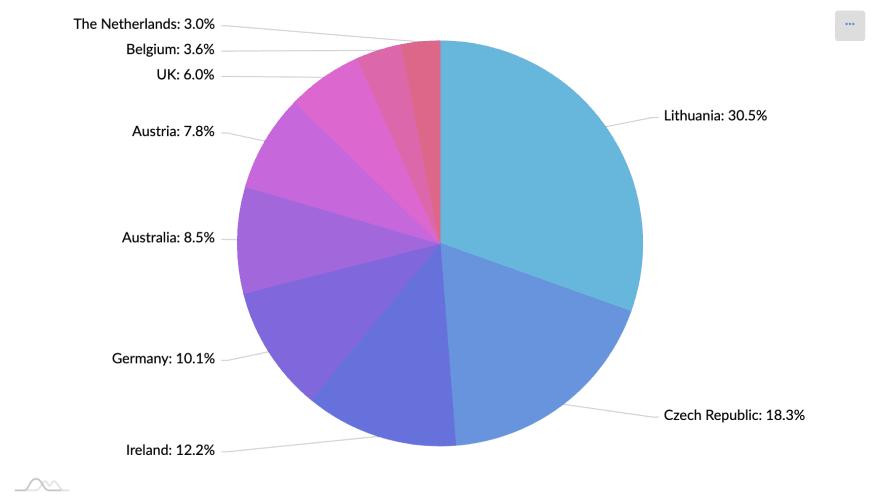
Please, enjoy the visualization in javascript inside Jupyter notebook.
Also, let me know if you need any helps to embed nice modules in Jupyter notebook.

Top comments (0)