This is a special day for me. Jaeger is the leading open source project for distributed tracing today, and I'm proud to share that we at Logz.io have launched the world's first managed Jaeger service in general availability!
This means that we've specialized in running Jaeger in production with all the related installation, configuration, upgrades etc., so that you don't need to worry about that.
This is the sign of a successful open source project: when the industry recognizes the benefits and leadership of a project, the natural evolution is seeing commercial and enterprise grade offering around that. I'm glad to say that we were the first, and I'm certain there will be many more to follow.
Upstream First
We are part of the community. We work upstream and contribute our Jaeger work back, so that everyone in the community can benefit from it, whether using our managed service or DIY fashion.
Our contributions already made their way into the recent project releases. We're working on bigger projects such as the Aggregated Trace Metrics proposal, to make Jaeger even more impactful, and with a more delighting user experience.
Backing The Best Open Source Projects
We believe in open source. Logz.io's strategy is to identify the best open source tools for monitoring and observability, and enable them as a managed service for the community, so everyone can benefit from the open source in a hassle-free and enterprise-grade fashion.
We started with ELK Stack for log management and security, then on to open source Grafana and Prometheus for metrics monitoring.
Then it was time to address the missing pillar in our observability platform: distributed tracing.
We've adopted Jaeger internally for our engineering and DevOps needs with great results. We've also seen the traction of Jaeger and the active community building around it. As partners in the Cloud Native Computing Foundation (CNCF), we value the fact that Jaeger is backed by CNCF and its ecosystem. We also value Jaeger's upfront adoption of OpenTracing and OpenTelemetry, in which we are also active.
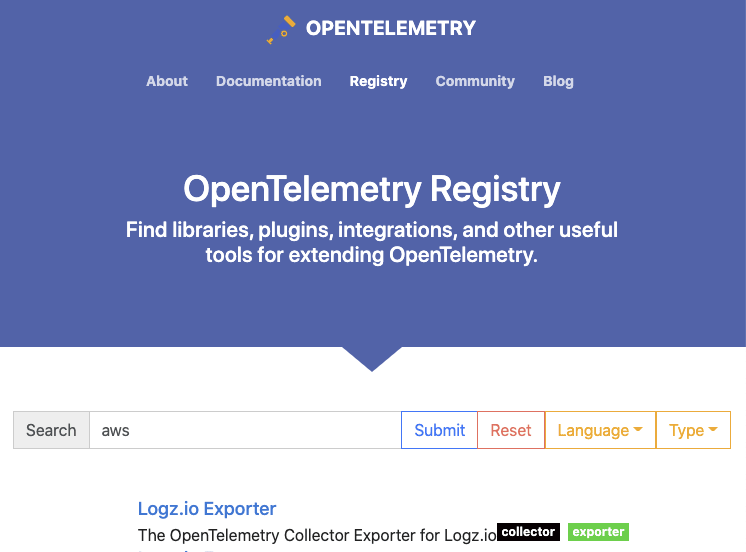
In fact, if you use OpenTelemetry Collector, then you can use its Logz.io exporter to send your trace data.
 if #aws can announce, then so can I:
@logzio new exporter is now officially on #OpenTelemetry 🚀.
And we're investing on @opentelemetry and @CloudNativeFdn related projects to contribute #opensource enhancements *upstream*. stay tuned06:41 AM - 23 Oct 2020
Enterprise Grade
We run Jaeger backend in combination with Kafka and Elasticsearch, according to Jaeger's best practices. Our years-long experience running large Elasticsearch and Kafka clusters in multi-region and multi-cloud environments lets us guarantee a production grade service.
We also enhance the open source with enterprise grade capabilities such as SSO, user and account management, compliance, 24x7 support and more, which help ease our users' journey to distributed tracing.
The Road to Open Observability
The end goal is not just a managed version of Jaeger or other open source tools. Our goal is to take the disparate siloed OSS projects and make them play together in harmony:
An open observability platform.
This means that you can augment Jaeger UI with Kibana, and explore your spans and create dashboards in Kibana UI.
This also means you can correlate between your logs, metrics and traces easily, seamlessly having your search context transferred between the different tools.
It also means you can send your telemetry data with common open source frameworks, such as OpenTelemetry, Prometheus, Fluentd or Beats.
It's just the beginning. Combining the different telemetry data and different open source frameworks opens up many exciting opportunities, such as monitoring aggregated trace metrics with Grafana dashboards and other ways to visualize and explore your traces; correlated alerts combining conditions on multiple telemetry data types; and sophisticated AI and ML algorithms to extract insights out of the data.
Open source is eating the world. It is the key to unlocking observability. We are here to support that with the community.


Top comments (0)