Introducing a New Web Vital: Time to Usability (TTU)
When thinking about application performance, the go to strategy is to "Measure, Measure, Measure." But not all metrics are created equal. Tools like Lighthouse and Core Web Vitals provide a great high-level view and are useful for debugging, but they don’t capture performance issues specific to your app’s core functionality.
What if we had a metric that measured when users can start using your app, not just when the page loads, but when it becomes truly usable? That’s why I’m introducing Time to Usability (TTU): a new way to measure performance that focuses on real user experience rather than just technical readiness.
In this guide, I’ll show you how to use the Performance API to instrument your app, break down every millisecond and capture TTU to optimize performance where it really matters.
How to Measure TTU:
Not everything that can be measured matters when applied to your application context. Traditional performance metrics like First Contentful Paint (FCP) or Largest Contentful Paint (LCP) tell us when content appears on screen, but they don’t indicate when an app is actually usable.
To measure TTU, you can ask the following question: How quickly can users start using the app’s core feature?
Some real-world examples:
• VS Code → How fast until the user gets a blinking cursor and can start coding?
• Slack → How fast until the user can open a chat and send a message?
• Postman → How fast until the user can send an API request?
Unlike generic performance scores, TTU is application-specific. It shifts the focus from technical implementation details to real usability, helping developers measure what truly impacts user experience.
How TTU Differs from Time to Interactive (TTI)
I can hear you thinking, hold on a minute, we already have a metric for that is called Time to Interactive (TTI)
Both Time to Usability (TTU) and Time to Interactive (TTI) measure when an app becomes usable, but they focus on different aspects:
| Metric | What It Measures | Why It Matters | Limitations |
|---|---|---|---|
| Time to Interactive (TTI) | When the page is fully interactive (event handlers registered, main thread idle). | Ensures the app won’t feel sluggish when users try to interact. | A page can be "interactive" but still not functional for its core task. |
| Time to Usability (TTU) | When users can start using the app’s main feature (e.g., sending a message in Slack, coding in VS Code). | Aligns performance measurement with real-world usability. | Requires application-specific instrumentation—generic tools don’t track it automatically. |
While TTI ensures technical readiness, TTU reflects real usability and helps developers optimize what actually matters to users.
Instrumenting Your App with Performance Markers
One of the best places to start is app launch performance, the one thing every single user experiences and directly impacts the first impression and usability.
The Performance API’s mark and measure methods let us place custom timestamps at key points in the user journey and calculate the time between them.
Collect the Data Using performance.mark()
Just like adding console.log() statements to debug your code, you can use performance markers to log how long key operations take. The Performance API’s mark method allows you to timestamp specific points in your app’s execution.
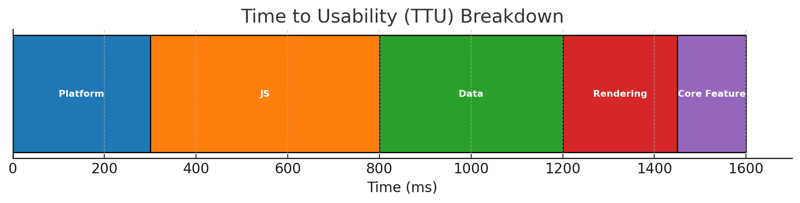
As an example, we’ll divide the app launch process into five key phases and then aggregate them into Time to Usability (TTU):
- Platform Initialization – App container, browser, or runtime initialization. (As an example, in an Electron App, this is the main process bootstrap until the renderer process initialises)
- Downloading, Parsing & Compiling JavaScript – First page load, downloading and executing scripts.
- Fetching Data – Making API calls to retrieve necessary data.
- Rendering the Critical Flow – Displaying the UI needed for interaction.
- Core Feature Ready – When the main feature is rendered and fully usable (TTU).
Here’s how you can track each phase of app launch using performance.mark():
// Mark platform initialization start
performance.mark("platform_init_start");

// Simulate platform setup
await setupPlatform();
performance.mark("platform_init_end");

// JavaScript loading phase
performance.mark("js_loading_start");
await loadJavaScriptBundles();
performance.mark("js_loading_end");

// Fetching data phase
performance.mark("fetch_data_start");
await fetchInitialData();
performance.mark("fetch_data_end");

// Rendering the critical flow
performance.mark("render_start");
await renderCriticalUI();
performance.mark("render_end");

// Mark when core feature is ready (TTU)
performance.mark("core_feature_ready");

// Aggregate total TTU
performance.measure("Platform Initialization", "platform_init_start", "platform_init_end");
performance.measure("JS Processing", "js_loading_start", "js_loading_end");
performance.measure("Data Fetching", "fetch_data_start", "fetch_data_end");
performance.measure("Rendering", "render_start", "render_end");
performance.measure("Time to Usability (TTU)", "platform_init_start", "core_feature_ready");

// Log all performance measures
const measures = performance.getEntriesByType("measure");
measures.forEach(entry => {
  console.log(`${entry.name}: ${entry.duration.toFixed(2)}ms`);
});
 .
.
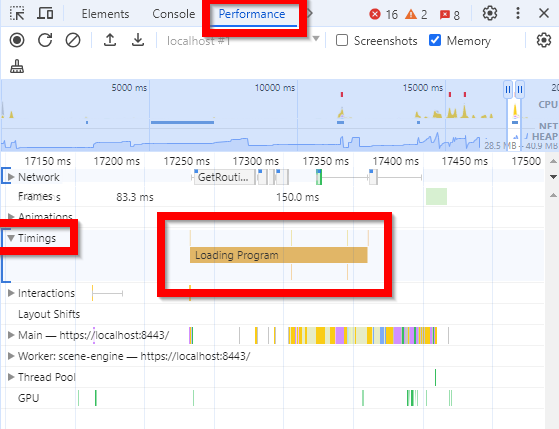
You can also see the performance markers using Chrome Developer Tools under the Performance tab -> Timings when running a performance profile.
Measuring performance locally is useful, but real-world performance varies across devices, networks, and user environments. To get meaningful insights, you need to send this data to a telemetry, logging or analytics platform where you can aggregate, analyze, and visualize it.
For example, you can send the collected TTU data to an observability tool or a custom logging service.
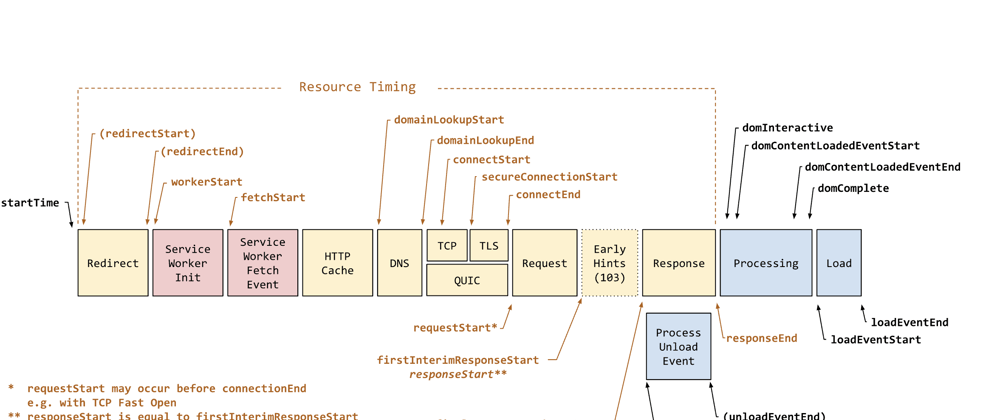
Measuring Page Load Performance with The Resource and Navigation Performance Entries
Once you have identified the bottlenecks, you can go deeper. For example, inspecting the page navigation and the resources (i.e JavaScript assets) that are downloaded during the initial page load.
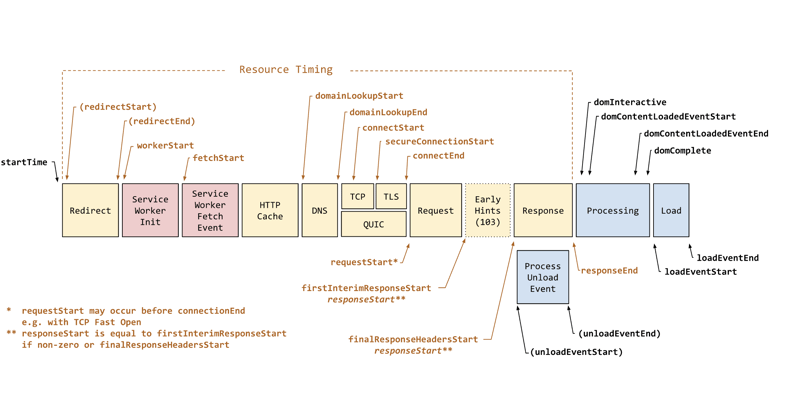
1. Measuring Document Load with PerformanceNavigationTiming
The PerformanceNavigationTiming API gives you a detailed breakdown of the navigation process, from the first request to when the page is fully loaded:
const navigation = performance.getEntriesByType("navigation")[0];

console.log(`DNS Lookup: ${navigation.domainLookupEnd - navigation.domainLookupStart}ms`);
console.log(`TCP Connection: ${navigation.connectEnd - navigation.connectStart}ms`);
console.log(`TTFB (Time to First Byte): ${navigation.responseStart - navigation.requestStart}ms`);
console.log(`DOM Load: ${navigation.domContentLoadedEventEnd - navigation.startTime}ms`);
console.log(`Page Load: ${navigation.loadEventEnd - navigation.startTime}ms`);
2. Measuring Individual Resources with performance.getEntriesByType('resource')
Beyond document load times, you can track how long each JavaScript file, CSS, image, or API request takes:
const resources = performance.getEntriesByType("resource");

resources.forEach(resource => {
  console.log(`${resource.name}: ${resource.duration.toFixed(2)}ms`);
});
This is especially useful for tracking third-party scripts, which can slow down page performance.
3. Advanced: Identifying Network vs. Service Worker Loads with Server Timing API
A more advanced technique is using a Server-Timing header to tag responses. An example use case is to differentiate network loads (cache misses) vs. service worker cache loads (cache hits).
The Service Worker can add a custom header to all requests that are intercepted and served from it:
Server-Timing: cache-hit;desc="Loaded from Service Worker"
And retrieve this information for each resource (asset downloaded by the page)
const resources = performance.getEntriesByType("resource");

resources.forEach(resource => {
  if (resource.serverTiming.length > 0) {
    console.log(`${resource.name} loaded via: ${resource.serverTiming[0].description}`);
  }
});
This is one of the use cases, but you can also send a custom server timing header to capture database read/write operation times, CPU time, and file system access.
Synthetic Monitoring vs. Real User Monitoring (RUM)
Performance isn’t a one-time optimization, it’s an ongoing process. This is where Synthetic Monitoring and Real User Monitoring (RUM) complement each other.
• RUM gives you real-world data from actual users, but it’s a lagging metric, it tells you what happened after users experience an issue.
• Synthetic Monitoring proactively runs tests in controlled environments, helping detect regressions before they impact users.
The good news? The performance markers are useful in both Synthetic tests and Real User Metrics, you just need to send the data to your telemetry systems.
Conclusion
The bad news? There are a couple of caveats to keep in mind:
The Performance API itself has a small overhead. While minimal, instrumenting too many markers or collecting excessive data could impact performance. However, the benefits far outweigh the cost, the insights you gain will help you optimize the real bottlenecks in your app.
Measuring TTU is a manual and custom process. Unlike generic performance metrics, Time to Usability (TTU) requires thoughtful instrumentation based on your app’s core functionality. There’s no one-size-fits-all solution, it’s up to you to define and measure what truly matters for your users.
With the Performance API, you have the tools to go beyond generic benchmarks and truly understand what makes your app feel fast. By combining custom markers, resource timing, and telemetry, you can continuously measure, optimize, and improve your app’s real-world performance.
Performance isn’t just about numbers, it’s about user experience! 🚀

Top comments (1)
Great ideas. Also , just to add an alternative point of view, it should not all necessarily be a manual process.