Hi Community,
This post is a introduction of my openexchange iris-python-apps application. Build by using Embedded Python and Python Flask Web Framework.
Application also demonstrates some of the Python functionalities like Data Science, Data Plotting, Data Visualization and QR Code generation.
Features
-
Responsive bootstrap IRIS Dashboard
-
View dashboard details along with interoperability events log and messages.
-
Use of Python plotting from IRIS
-
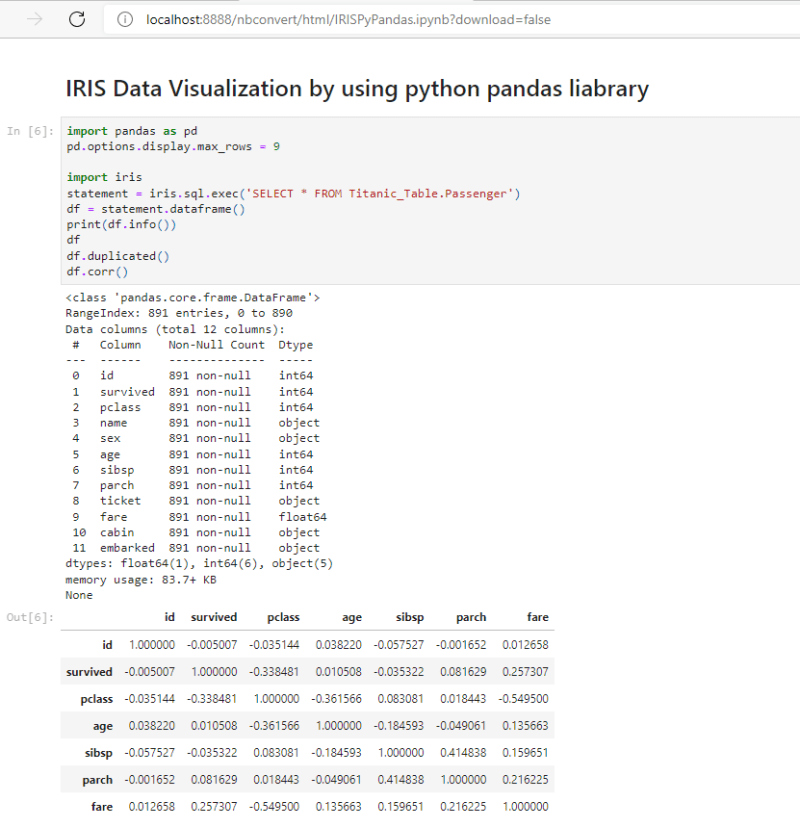
Use of Jupyter Notebook
-
Introduction to Data Science, Data Plotting and Data Visualization.
-
QR Code generator from python.
Responsive bootstrap IRIS Dashboard by using embedded python
Below is the code of user defined function get_dashboard_stats() to get data from SYS.Stats.Dashboard IRIS class by using embedded python :
   import iris
   // make sure to connect with %SYS namespace by using custom object script function
    iris.cls("Embedded.Utils").SetNameSpace("%SYS")
    ref = iris.cls("SYS.Stats.Dashboard").Sample()
    last_backup = ref.LastBackup
    #check if variable is empty
    if not last_backup:
        last_backup = "Never"
    #content data dictionary to store data to be used in HTML page
    content = {
        'ApplicationErrors':ref.ApplicationErrors,
        'CSPSessions':ref.CSPSessions,
        'CacheEfficiency':ref.CacheEfficiency,
        'DatabaseSpace' : ref.DatabaseSpace,
        'DiskReads' : ref.DiskReads,
        'DiskWrites' : ref.DiskWrites,
        'ECPAppServer' : ref.ECPAppServer,
        'ECPAppSrvRate' : ref.ECPAppSrvRate,
        'ECPDataServer' : ref.ECPDataServer,
        'ECPDataSrvRate' : ref.ECPDataSrvRate,
        'GloRefs' : ref.GloRefs,
        'GloRefsPerSec' : ref.GloRefsPerSec,
        'GloSets' : ref.GloSets,
        'JournalEntries' : ref.JournalEntries,
        'JournalSpace' : ref.JournalSpace,
        'JournalStatus' : ref.JournalStatus,
        'LastBackup' : last_backup,
        'LicenseCurrent' : ref.LicenseCurrent,
        'LicenseCurrentPct' : ref.LicenseCurrentPct,
        'LicenseHigh' : ref.LicenseHigh,
        'LicenseHighPct' : ref.LicenseHighPct,
        'LicenseLimit' : ref.LicenseLimit,
        'LicenseType' : ref.LicenseType,
        'LockTable' : ref.LockTable,
        'LogicalReads' : ref.LogicalReads,
        'Processes' : ref.Processes,
        'RouRefs' : ref.RouRefs,
        'SeriousAlerts' : ref.SeriousAlerts,
        'ShadowServer' : ref.ShadowServer,
        'ShadowSource' : ref.ShadowSource,
        'SystemUpTime' : ref.SystemUpTime,
        'WriteDaemon' :  ref.WriteDaemon,
        'tot_pro'   : tot_pro,
        'tot_msg'   : tot_msg,
        'tot_usr'   : tot_usr,
        'tot_apps'  : tot_apps,
        'tot_ev' : tot_ev,
        'tot_ev_assert' : tot_ev_assert,
        'tot_ev_error' : tot_ev_error,
        'tot_ev_warning' : tot_ev_warning,
        'tot_ev_info' : tot_ev_info,
        'tot_ev_trace' : tot_ev_trace,
        'tot_ev_alert' : tot_ev_alert
        }
    return content
Below is the main python code (app.py) to call get_dashboard_stats() user defined function to get deta, render index.html page and pass content data to it:
@app.route("/")
 def index():
    #get dashboard data in dictionary variable
    content = util.get_dashboard_stats()
    return render_template('index.html', content = content)
index.html use content dictionary variable to display related data. e.g { content.CSPSessions } is used to display CSP Sessions:
<div class="row">
          <div class="col-lg-2 col-6">
            <!-- small box -->
            <div class="small-box bg-info">
              <div class="inner">
                <h3>{ content.CSPSessions }</h3>
                <p>CSP Sessions</p>
              </div>
              <div class="icon">
                <i class="ion ion-ios-photos"></i>
              </div>
              <a href="/processes" class="small-box-footer">View Details <i class="fas fa-arrow-circle-right"></i></a>
            </div>
 </div>
From dashboard we can also view details of running processes, messages, security users, applications and event logs by using iris.sql.exec() functionality.
Application also display plotting in HTML by using python matplotlib library:
Below is the python code to display ploting in html:
app.route("/matplot")
def matplot():
    #Returns html with the img tag for your plot.
    content = util.get_sidebar_stats()
    num_x_points = int(request.args.get("num_x_points", 50))
    return render_template('matplot.html', content = content, num_x_points = num_x_points)
@app.route("/matplot-as-image-<int:num_x_points>.png")
def plot_png(num_x_points=50):
    # renders the plot on the fly.
    fig = Figure()
    axis = fig.add_subplot(1, 1, 1)
    x_points = range(num_x_points)
    axis.plot(x_points, [random.randint(1, 30) for x in x_points])
    output = io.BytesIO()
    FigureCanvasAgg(fig).print_png(output)
    return Response(output.getvalue(), mimetype="image/png")


Top comments (0)