So it turns out AWS did really well in 2018, pulling in $ 25.7 billion, which is a big step up compared to 2017 when they did "only| $ 17 billion. Who would have thought, right? 2019 is not going to be any different since their new products are really starting to take off.
The caveat is that whenever people are flocking to new services like AWS Lambda and API Gateway, there will some that will screw up in one way or another and most often than not, the cost of said screw up is an AWS bill that's through the roof. Another big issue could be the complete misconfiguration of your resources. Let's look at a simple way to keep track of that cost and make sure you are managing your resources in the most effective way possible.
We'll need a couple of things to get started.
- Access to your AWS Account
- A Dashbird account.
- 5 minutes of your precious time.
Some may argue that you could be using Cloudwatch or other 3rd parties to do one or more of the optimization I'm going to mention in this article and while that's true, I love Dashbird for the effortless clarity it provides.
Let's start with the setup
I'll assume you already have an AWS account and just move on to the Dashbird setup phase which is really easy. Once you register you'll be met with the AWS account setup screen and you'll have to deploy the Dashbird stack and set up delegation.
At this point, you'd be asking yourself "hold on, do I give access to my account to these guys?". We only get your logs and they are encrypted and stored in S3. After that logs are analyzed into metrics data which is then stored in a secure db hosted on AWS.
Is it safe? YES!
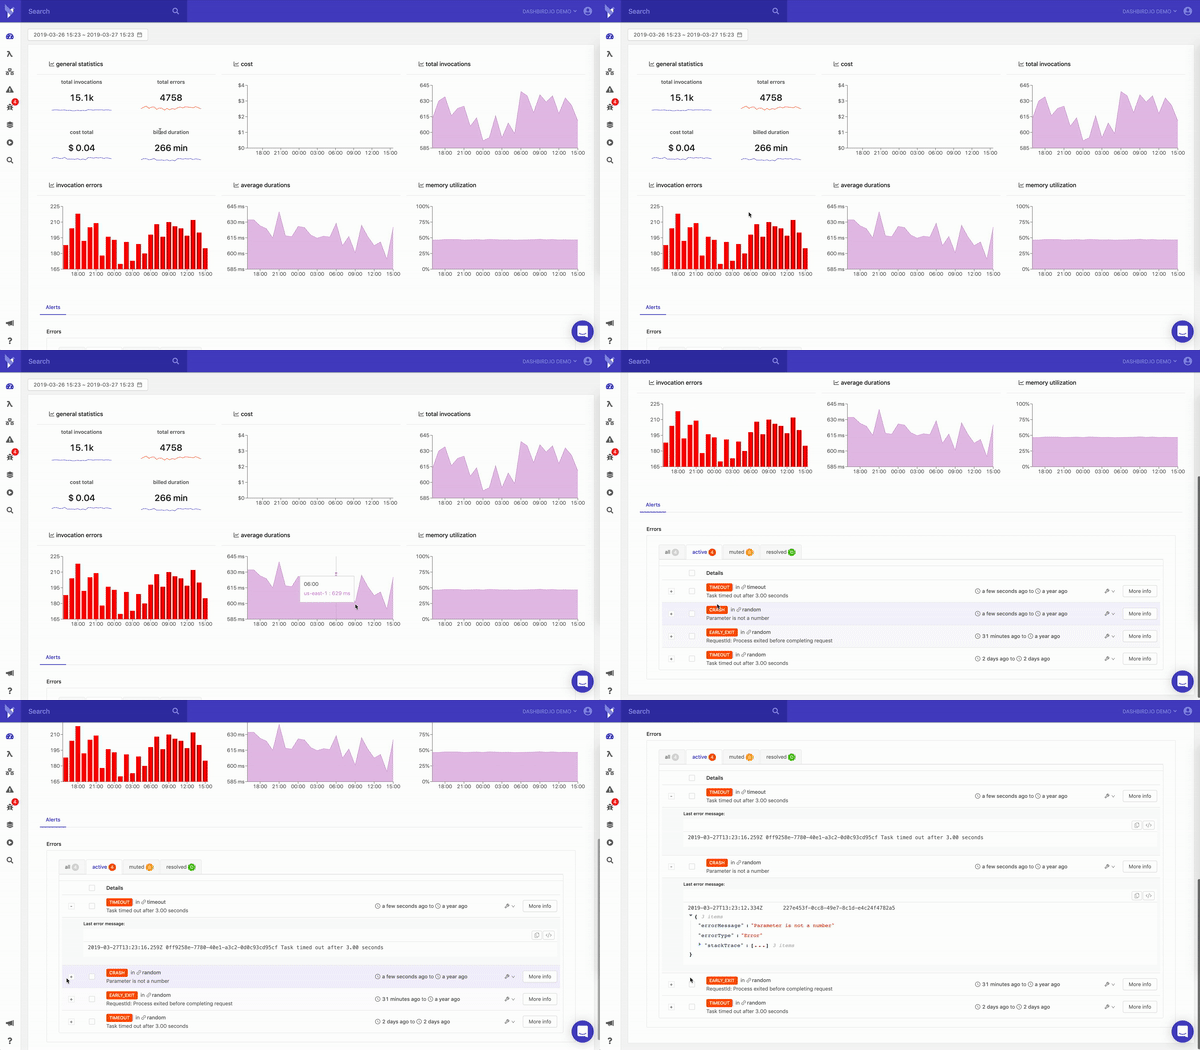
Once the setup is done the importer will start ingesting your logs which usually take about 2 minutes and as soon as that's done you'll be met with the Dashbird dashboard(say that 3 times fast) which will paint quite a picture of your entire application, invocations, cost, and any errors you might have. This is where you'll come to get a bird's eye view of your application.
Cost tracking
The beauty of Lambda is how easy and effortless a function can scale to meet your needs but at the same time, that scale will make a dent in your wallet. Imagine, instead of one function scaling you have 10, 50 or even 100 functions. That little dent in your wallet becomes now a huge pain in your behind, especially if it caught you off guard.
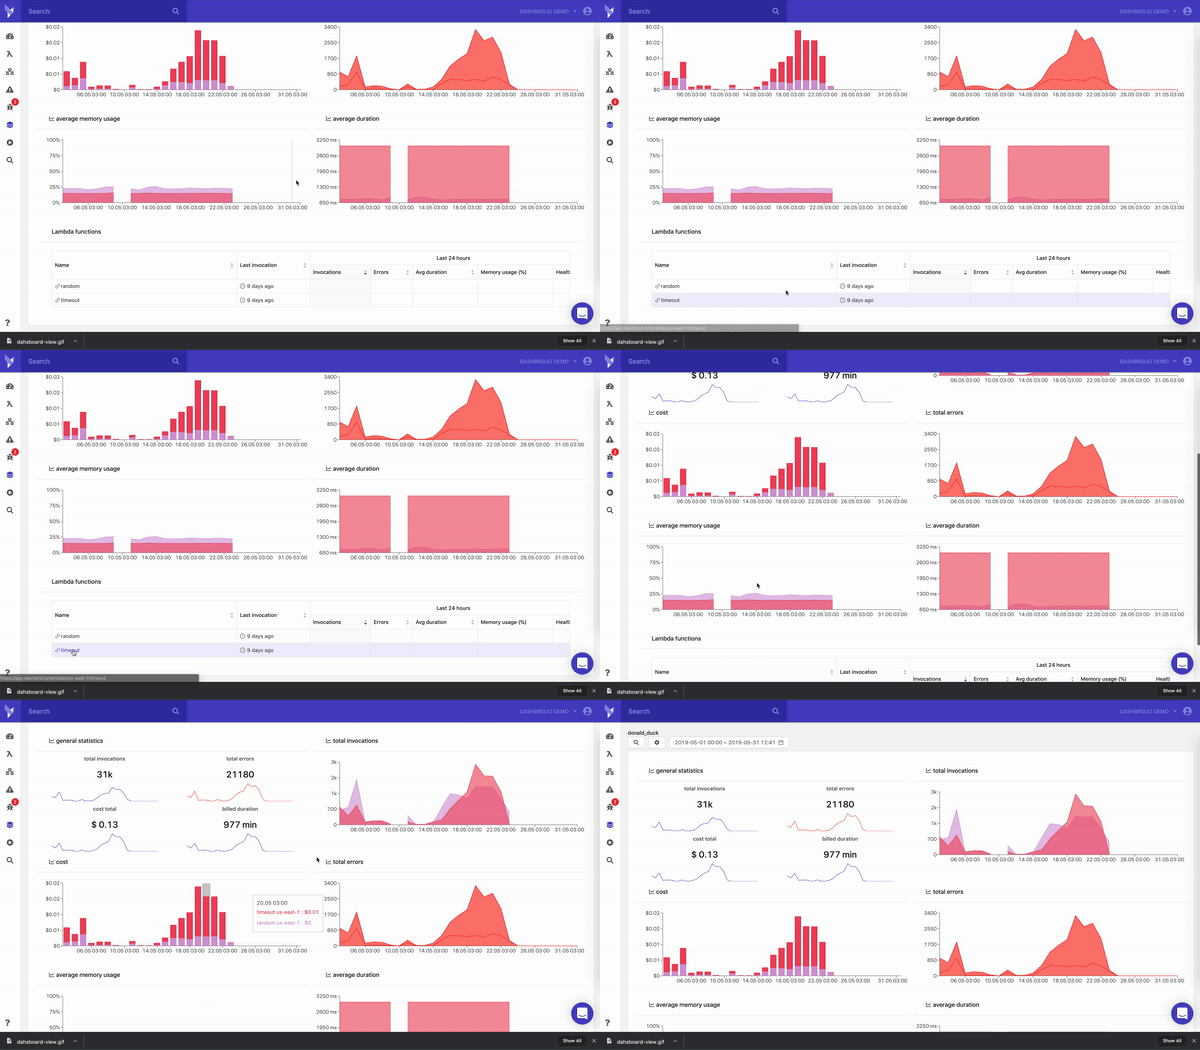
This is where the beauty of Dashbird comes to shine. Not only you'll be able to see the total cost of your serverless application for any given time but you'll be able to even dig down to the function level and see how much you'll be spending per function.
Most companies out there use microservices that are composed of a number of functions. While you could just go out and count every function in said microservice and figure out the total cost of that way, with Dashbird you can set up "Project Views" which is a clever way to say that you can group functions together to make it easy to keep tabs on a particular functionality of your application, a microservice or an entire project.
Performance optimization
Now with the cost out of the way we can talk about optimizing the functions themselves. AWS Lambda charges both by invocation and billed duration so you'll more vectors to improve here since you get to customize a few things.
One of the customizations options for your Lambda functions is the RAM, which can go from 128 to 3008 in 64 mb increments. The more RAM you use the more expensive that invocation will have. The trick is to have a balance between the RAM usage and billed duration. So if the function uses 5% of your allocated memory consistently you should probably think about lowering the RAM allocation for the function or on the other side of the spectrum if you see the function is using 85% or more you should probably start adding a bit more memory to get it to execute faster.
Faster execution = better user experience and a lower AWS bill.
With Dashbird it's easy to look at the function performance. You open your Lambda view page and select the function you want to examine and a little window will slide from your right displaying all the information you'll ever need to adjust this setting.
Highlighted you'll see the duration and memory utilization and I can't stress how important it is to keep track of these. If you have a user-facing function that needs to respond quickly, make sure that duration number is as small as possible and you do that by increasing the memory limit. You don't want to go overboard tho, as adding too much RAM that you actually need will be an overkill.
Error tracking
Another important side of serverless development is error tracking and with the lack of observability that this technology proposes it's imperative to have a simple way to see what's happening or if something goes belly up.
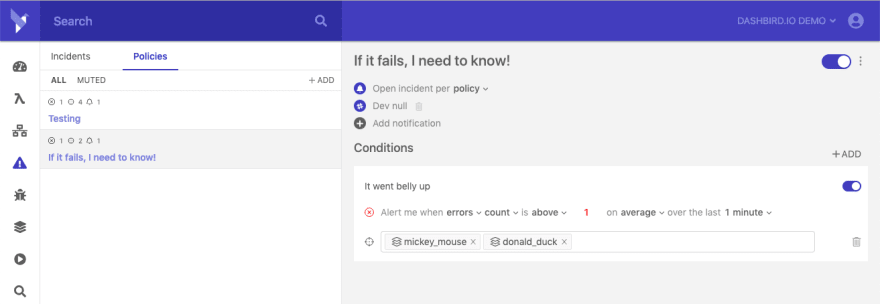
With Dashbird you have the option to create custom Error policies that not only trigger when something breaks but also when something doesn't run within the correct parameters.
Like I've mentioned before, Dashbird is one of the options available to developers in order to bring insight into their serverless applications and if you'd have the option to look at any other 3rd party solution I'd love to hear your thoughts.


Top comments (0)