
Challenge Details
To celebrate the new chart type additions of JSCharting 3.0 we are launching a Venn and Euler Diagram challenge where top entries will win free licenses.
- Download JSCharting 3.0 if you haven't already.
- Create your own Venn Diagram or Euler Diagram chart using JSCharting and send us a link to your site, blog, codepen or tweet #JSCVenn.
- Win a free license of the complete JSCharting bundle (top 3 entries).
Get inspired from some of the example Venn and Euler charts included. The JSCharting download will also include these samples and their code.
What is the difference between a Venn and Euler Diagram?
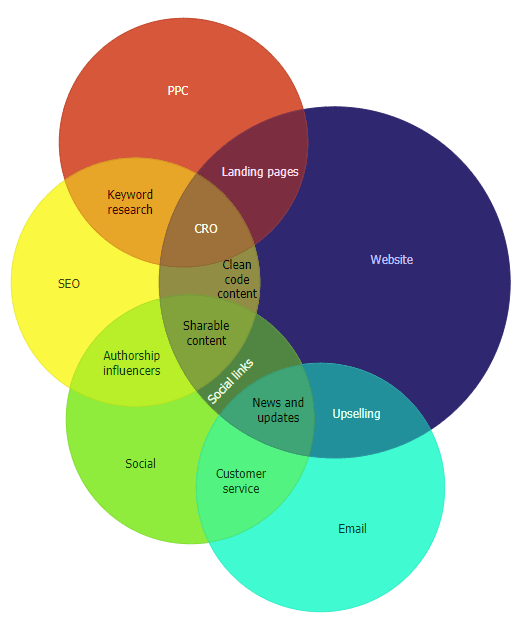
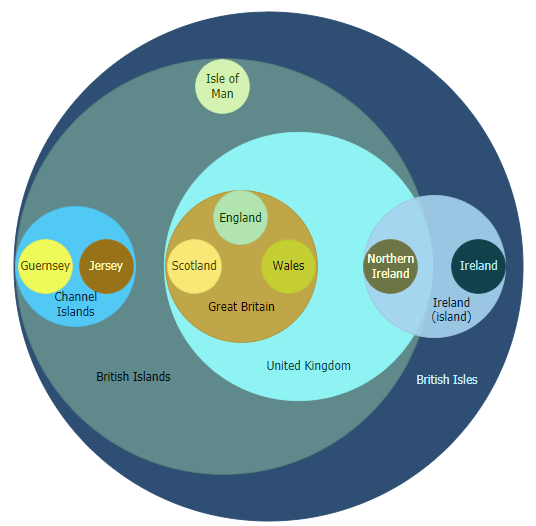
A Venn diagram shows all possible relationships between two or more sets while an Euler diagram only shows the relationships that are actually possible in the real-world.
Example Venn Diagram: Click the images below for interactive Javascript and SVG versions of these charts.
Example Euler Diagram:
We can't wait to see the Venn / Euler diagrams you come up with! If you have any questions about how to use the JavaScript charting library, please reach out to the support team and they will be happy to help.

Latest comments (0)