Recently, I had a task to start working with a new framework - Blazor. This is the first time I have dealt with it, so for a start I decided to search for some additional information on it on some blogs.
One of the critical features of Blazor, which most developers have mentioned, is the ability to use both C# and various JavaScript libraries when creating an application. In turn, I was very bribed that the whole integration process is simple and even speeds up the work on the project because it adds more mobility.
In this short tutorial, I'll show you my experience, how using Blazor and Flexmonster Pivot Table & Charts library create the simplest reporting app with a pivot grid in 10 minutes.
Before we start, check that you have installed the .NET Core 2.1.300 (or later) SDK and it works properly.
№1. Create the simplest Blazor app
So to create the base, you just need to run one command in the terminal (could it be even easier?):
dotnet new blazorserver -o BlazorApp --no-https
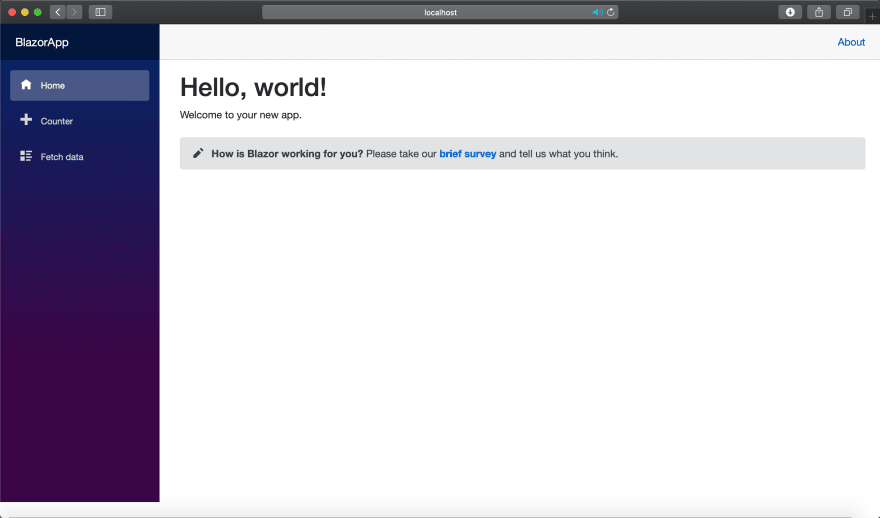
You will see a new folder BlazorApp with all the files needed in your current location, and on http://localhost:5000, you will find the basic Blazor app template.
№2. Add the Flexmonster Pivot to your app
Instead of “ Welcome to your new app“ our task is to add a pivot grid to the main page.
To do this install the Flexmonster.Blazor package:
dotnet add package Flexmonster.Blazor
Add it to the project by writing the following line in the import file (_Imports.razor):
@using Flexmonster.Blazor
Add the script to the main HTML file (_Host.cshtml) so it looks like this:
<head>
   <!-- Other metadata tags -->
   <link href="css/app.css" rel="stylesheet" />
   <link href="PivotBlazor.styles.css" rel="stylesheet" />
   <script src="_content/Flexmonster.Blazor/blazor-flexmonster.js"></script>
   <!-- Other metadata tags -->
</head>
And finally, let's add the table itself to the main page. In Index.razor file, replace the header and caption with the Flexmonster Pivot Grid caption and the component itself with the parameters you need (enable the Toolbar and define width and height of the pivot):
@page "/"
<h1>Flexmonster Pivot Grid</h1>
<FlexmonsterComponent Report="@report"
                     Toolbar="true"
                     Width="100%"
                     Height="600">
</FlexmonsterComponent>
@code {
    string report = "https://cdn.flexmonster.com/reports/report.json";
}
In the @code block, we specify the path to the report displayed on the page and pass it to the component as a variable.
№3. Run your Blazor report app
That’s all! Simply run your app in the terminal with dotnet run and open the http://localhost:5000.
All these steps will take you about 10 minutes, and you will see the result immediately. All that remains is to take a closer look at the Flexmonster Pivot Grid and Blazor documentation to unleash this framework’s capabilities fully!
If this tutorial were helpful for you, I would be thrilled to hear your feedback and ideas about this integration.


Oldest comments (0)