
Hello everyone, I am Kei and I'm here to talk about database optimization in PostgreSQL
One question before We start.
How do you store data when developing applications these days?
Recently, many small application developers are using so-called NoSQL, such as Firestore.
I myself use Firestore as my main data store for both work and pleasure, so I have recently moved away from the strong SQL and PostgreSQL RDBs that I am familiar with from the past.
But I'm starting to think lately that this is not a very good thing.
Naturally, NoSQL is convenient at first glance because of its fast implementation and transaction speed, but after using it for a long time, you start to realize that the running cost of NoSQL is surprisingly high.
Especially when handling core business data, it is difficult to ensure the relevance of data, and you have to be even more careful. Therefore, I believe that NoSQL cannot be a perfect substitute for RDB, and that it is important to use it where it is essential. There is no silver bullet.
So, recently I've been switching where to store data from Firestore to PostgreSQL for some of my projects, but it's been a few years since I've used it and I've forgotten a lot of things, so I wanted to relearn some things.
So, I'm going to share some SQL How To's with a focus on improving database performance over the next few posts. (By the way, I will be using PostgreSQL.
Flow of Query
Now, since this is the first article in this series, let's start with what we are most likely to work on when performing database performance: query optimization.
To do this, the most important thing is to understand how DMBS receives and evaluates queries.
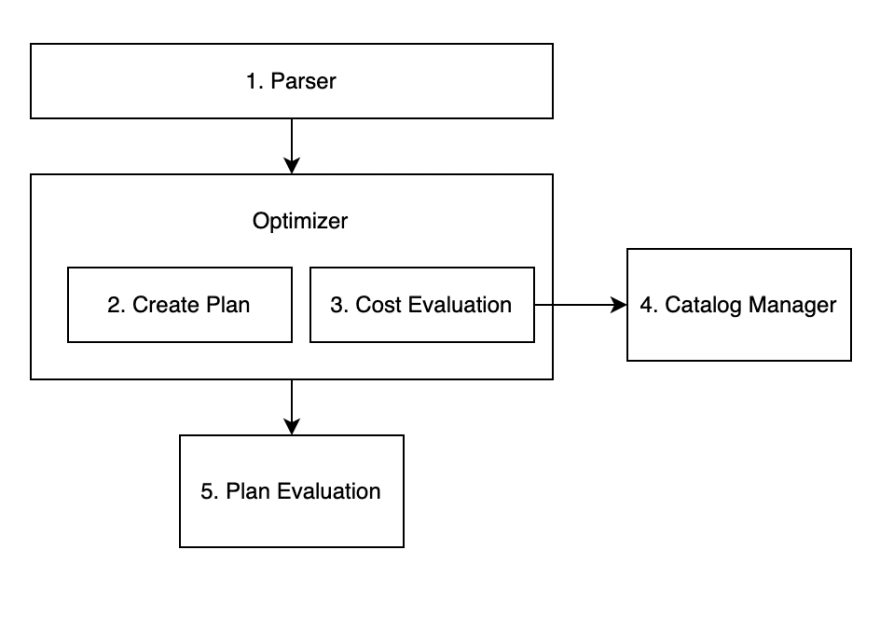
Raghu Ramakrishnan, Johannes Gehrke, Database Management System 3rd ed, McGraw-Hill, 2002, p.405
The figure above simulates the query processing flow.
- Parser
The role of the parser is to parse SQL statements. The parser parses the SQL statements that we normally write and execute, and checks them for syntax errors. After parsing is complete, the parser also converts the SQL to a format that can be processed by a DBMS.
- Optimizer
The Optimizer, as the name implies, creates the best way to access the data, and it selects the least expensive execution plan based on various conditions such as the presence or absence of Indexes, the degree of data distribution, and information on the internal parameters of the DBMS itself.
- Catalog Manager
The information needed to develop an execution plan in Optimizer is done through the Catalog Manager. The Catalog Manager stores statistical information about the tables, for example, the number of records.
- Plan Evaluation
After the Optimizer has generated the execution plans from the SQL statements, it is responsible for selecting the best plan from these execution plans. Unfortunately, the plan selected by Plan Evaluation is not always the best.
Now that you have come this far, I am sure that you somehow understand the importance of the Optimizer function in improving the performance of the database.
But whatever the case may be, let's write and execute some SQL at hand to see how the whole process works!
create table users(
    id serial primary key,
    user_name varchar(10) not null
)

do $$
begin
for r in 1..1000 loop
insert into users(user_name) values(r || 'user');
end loop;
end;
$$;

explain
select * from users where users.user_name = '5000user';
First, without thinking, create a user table and then create records for 1000 users.
Now let's add the word explore to the SQL statement and run it.

Interestingly, the information was different from what we normally see on our screens. Yes, this is the execution plan itself, which shows how the query is being executed, and this is how we, as engineers, can make sure that the execution plan is properly formulated.
Here is how we see this information
-
Seq Scan
This represents the type of operation, which can vary depending on the situation. Also note that the notation varies depending on the type of DBMS. In this case, since we are using PostgreSQL, this Seq Scan indicates that a full scan is being performed.
-
users
This is the name of the operation target. In this case, we are operating on the users table, so it is denoted as users.
-
In parentheses
Information about the operation target is displayed here. The cost and number of rows to retrieve, and width is the average size of the rows to be retrieved.
Those with good senses may have already noticed here that this time, user_name is set sequentially numbered, so rows=1 should not be the case. But this is no mystery; the plan itself is created in an optimal way. However, as I explained earlier, the execution plan is created based on information from the catalog manager, so the current situation is that the information from the catalog manager is incorrect, i.e., the execution plan is created based on the wrong information.
Although we said that the catalog manager creates statistics based on the information in the tables, the fact is that statistics are not updated immediately after data is stored in the database. (It is usually done automatically on a regular basis.
(Usually, it is done automatically on a regular basis.) Also, if the amount of data is small, it does not have a significant impact on performance even if the statistics update is not done immediately. However, if you have a large amount of data at one time, as in this case, or if you want to measure performance properly after the statistics are updated, the current state is not appropriate.
So I have to wait until the next update? When? Don't worry! Don't worry! postgreSQL has SQL to update the statistics.
analyze users;
This is all it takes to update the statistics in the users table. Try executing the same SQL statement as before and check the information.

As we expected, you see that rows is displayed as 1, which is the correct number of rows. However, it is important to note that the statistics are only a guide and do not necessarily show the correct number of rows. Especially for a simple query like this one, I am sure it is correct, but the more complex the query is, the more suspicious it becomes, so always keep this in mind.
Let's play a little more interestingly.
create table items(
    item_id integer not null,
    item_name varchar(10)
)

do $$
begin
for r in 1..100000 loop
insert into items values(r, (r ||'user' ));
end loop;
end;
$$;

analyze items;
drop table items;

create index item_name_idx on items(item_name);

explain
select item_name from items i
where i.item_name = '50000user';

Remember this value! Next, let's put something called index against user_name in the users table.
create index user_name_idx on users(user_name);

The results have changed from Seq Scan to Index Scan.
Now, here is a question for you: Have you ever heard of B-Tree?
(I'll spare you the details of B-Tree, as you can find plenty of information about it on the Internet.)
PostgresSQL also uses B-Tree, so it would be faster to put an index on user_name of items like this.
It should be faster to retrieve the data. However, when we look at the actual values, we see that the cost is lower before pasting the index.
Actually, this is because postgreSQL's EXPLAIN does not actually issue SQL, but returns an estimate of the execution plan. Therefore, if the values are off by a large amount, as in this case, you can get the correct information by specifying that you can actually execute the query.
drop index item_name_idx;

explain analyze
select item_name from items i
where i.item_name = '50000user';

Now let's add an index.
create index item_name_idx on items(item_name);

explain analyze
select item_name from items i
where i.item_name = '50000user';

With explain analyze, we can now see the correct execution time and it is clear that the index is effective.
Now that we know how to read the execution plan, let's try a more complex query.
What we will do here is split the categories into 1 and 2 according to the birth year of the monsters in the Pokémon table (the release date of each Pokémon).
create table monsters(
    id serial primary key,
    monster_name varchar(10),
    year integer
)

insert into monsters(monster_name, year) values('Picachu', 1996);
insert into monsters(monster_name, year) values('Chikorita', 1999);
insert into monsters(monster_name, year) values('Torchic', 2002);
insert into monsters(monster_name, year) values('Piplup', 2006);
insert into monsters(monster_name, year) values('Oshawott', 2010);
insert into monsters(monster_name, year) values('Fennekin', 2013);
insert into monsters(monster_name, year) values('Rowlet', 2016);
insert into monsters(monster_name, year) values('Scorbunny', 2019);
Also, let's write an SQL statement that gets exactly the same result in the two different method pictures.

case1
explain
select monster_name, '1' as category
from monsters m
where m.year <= 2006
union
select monster_name, '2' as category
from monsters m
where m.year > 2006

case2
explain
select monster_name,
case when year >= 2006 then
'1' else
'2' end as category
from monsters;

Let's run the queries for case1 and case2. To our surprise, we found that the results of the execution plan are very different between case1 and case2.
Why does this happen?
The reason is obvious: when we are doing union, we are using the select clause twice to combine the results of each. On the other hand, with the case method, the select clause is issued only once, resulting in fewer scans and lower execution costs.
So, what do you think? We have focused on the optimizer, but this is just a brief example, and we are only at the beginning of some very interesting database performance tuning.
Thank you!

Top comments (0)