
Human perception of video/image quality does not correlate directly with the amount of compression in a video (or image) and the perception of quality is influenced by physiological factors, cultural background or social trends (for example the amount color saturation or sharpness liked differs between people).
Image quality metrics is an active research topic which involves many adjacent areas such as biology and machine learning, as modeling human visual perception (or human visual system, HVS) is a very complex topic.
This post aims to provide pointers for anyone looking into image or video quality comparison or evaluation.
If you want to keep reading on the topic, sources are present at the end.
DISCLAIMER:
I only go through the "traditional" metrics (the ones using traditional mathematical approaches), note that there are a lot not listed which are deep-learning based. You can find a list of those HERE.

Executive summary
The most common visual metrics used in the industry for now are by far the objective full-reference PSNR and SSIM. The growing and as of today state-of-the-art metric is VMAF.
If you want to use no-reference metrics, BRISQUE is a simple and often used metric (even if less common than the full-reference).
Two metrics groups
We can isolate two types of video quality metrics families 1:
- Subjective, that present the images to groups of people and ask them to grade their view of the quality.
- Objective, that use image analysis to extract a value or set of values which can be compared.
Subjective tests
Subjective quality assessment methods are the most direct method to know how the observers feel about the video quality. These tests use groups of people to calculate the Mean Opinion Scores (MOS) . MOS is a measure used in the domain of Quality of Experience and telecommunications engineering, representing overall quality of videos with different properties.
The Difference Mean Opinion Score (DMOS) is the same idea but indicates how much the differences introduced in test videos degrade subjective picture quality.
Organizations such as International Telecommunication Union (ITU) or Video Quality Experts Group (VQEG) have recommended varieties of subjective assessment methods on images and videos.
These methods require very restrictive conditions (such as wall colors, time to display images, etc) and specialized hardware (color calibrated screens) in order for the tests to be comparable. International recommendations for subjective video quality assessment ITU-R BT.500-11 for example include specifications for how to perform many different types of subjective tests 2.
A subjective test looks like this:

Tests can be:
- double stimulus, where viewers rate the quality or change in quality between two video streams (reference and impaired)
- single stimulus, where viewers rate the quality of just one video stream (the impaired).
Some double stimulus tests are:
- DSCQS: double stimulus continuous quality scale (claims to be less sensitive to context than others).
- DSCS: double stimulus comparison scale.
For single stimulus:
- SSCQE: single stimulus continuous quality evaluation (claims to yield more representative quality estimates for quality monitoring applications).
Objective tests
The goal of objective tests research is to design algorithms that can automatically assess the quality of images or videos in a consistent manner and with minimal human intervention.
Objective tests can be split into three method groups1:
- Full reference method (FR-IQA), where one is assumed to have access to the "ground truth" image that is not altered (often called reference image).
- Reduced reference method (RR-IQA), where one has access to information (reduced image, features information, etc) about the "ground truth" image 3.
- No reference method (NR-IQA),where one has no access to the original image 4.
The Full reference method being the most used in the broadcast industry.
Full reference methods
These algorithms generally interpret image quality as fidelity or similarity with a "reference" image. Full-Reference methods often attempt to model physiological and psycho-visual features of the human visual system (HVS). These methods give an idea of the extent of deviation of a distorted image from the reference image.
The main methods are listed below. The state of the art as of today (2022-05-01) being VMAF and VQM.
PSNR: Peak signal-to-noise ratio 5
PSNR calculates the difference (mean square error) between the original image and its compressed version.
PSNR represents the ratio between the maximum possible power of a signal (the original image) and the power of corrupting noise (the corruption introduced by the compression) that affects the fidelity of its representation. It is expressed as a logarithmic quantity in decibel. The higher the PSNR is, the better (the higher the fidelity of the signal should be, note that an identical image should have an infinite PSNR).
PSNR has been the most used metric to measure losses from video compression, however it does not include the characteristics of the human visual system and thus is a good mathematical representation of degradation but not a good practical measure as most corruption would not be perceived by viewers.
You can find how it is calculated here and in 5.
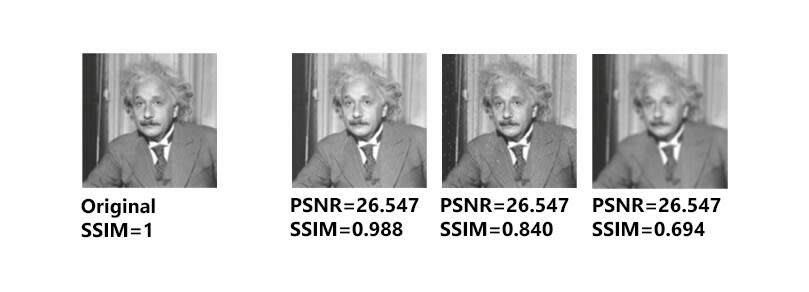
SSIM: Structural similarity index measure 6
SSIM is a perception-based model that considers image degradation as perceived change in structural information, while also incorporating perceptual phenomena, including both luminance masking and contrast masking terms.
Structural information is the idea that the pixels have strong inter-dependencies especially when they are spatially close (where PSNR only considers the difference between values independently of its placement). These spatial dependencies carry information about the structure of the objects in the visual scene. It is built on the assumption the measure of structural similarity can provide a good approximation to perceived image quality.
The basic model was developed in the Laboratory for Image and Video Engineering (LIVE) at The University of Texas at Austin and further developed jointly with the Laboratory for Computational Vision (LCV) at New York University.
SSIM is building on the limitations of PSNR by starting to add human visual system characteristics regarding structure perception and has been widely adopted in the industry. You can find how it is calculated here and in 6. You can see in the picture above that SSIM is capturing the difference in visual quality while the PSNR value stays equal.
MS-SSIM: Multi-scale Structural Similarity for Image Quality Assessment 7
This is a variant of SSIM. It supplies more flexibility than
previous single-scale methods in incorporating the variations of
viewing conditions. it calibrates the parameters that define the relative importance of different scales of structures.
FSIM: Feature Similarity Index for Image Quality Assessment 8
FSIM is yet-another variant of SSIM, it maps the features and measures the similarities between two images. FSIM goes from the assumption that the human visual system (HVS) understands an image mainly according to its low-level features. The phase congruency (PC), a dimensionless measure of the significance of a local structure, is used as the primary feature and is invariant to light changes in the image. The image gradient magnitude (GM) represents the gradient of the image and is employed as the secondary feature.
PC and GM play complementary roles in characterizing the image quality. After obtaining the local quality map, PC is again used as a weighting function to derive a single quality score.
IFC: Information Fidelity Criterion for Image Quality Assessment Using Natural Scene Statistics 9
In IFC, they approach the problem of image quality by proposing an information fidelity criterion that is based on natural scene statistics.
Researchers have developed sophisticated models to capture the statistics of pictures and videos of the visual environment. Using these statistical models in an information-theoretic setting, they developped a parameter-less algorithm that provides clear advantages over the traditional approaches. IFC is not a distortion metric, but a fidelity criterion. It theoretically ranges from zero (no fidelity) to infinity (perfect fidelity).
NQM: Noise Quality Measure [^16]
NQM decouples linear frequency distortion from noise and measures their effect on the human visual system. It takes into account the following:
- variation in contrast sensitivity with distance, image dimensions, and spatial frequency
- variation in the local luminance mean
- contrast interaction between spatial frequencies;
- contrast masking effects.
The distortion metric is calculated in three steps:
- find the frequency distortion in the degraded image.
- compute the deviation of this frequency distortion.
- weight the deviation by a model of the frequency response of the human visual system and integrate over the visible frequencies.
UQI: Universal Quality Index 10
In UQI, instead of using error summation it models the image distortion as the sum of three factors:
- loss of correlation
- luminance distortion
- contrast distortion
This metric is similar to PSNR but captures some distortions which are not picked up by the latter.
VSNR: Visual signal-to-noise ratio 11
VSNR uses a three-stages:
- It calculates contrast thresholds for detection of distortions via wavelet-based models of visual masking (to estimate if the difference with the original would be visible).
- If deemed visible (above threshold) it then it calculates the Euclidean distances in the distortion-contrast space (in the context of a wavelet-based decomposition).
- Calculates the linear sum of the distances in 2. as a global metric.
VSNR operates based on physical luminances and visual angle (rather than on digital pixel values and pixel-based dimensions) on both low-level and
mid-level properties of human visual system (HVS) and has provided good correlate with subjective studies (as you can see below)11.DMOS definition

MPQM: Moving Pictures Quality Metric 12
MPQM is based on a multi-channel model of the human visual system (HVS) that has been parameterized for video coding applications by psycho-physical experiments. The model claims to account for spatial and temporal aspects of the HSV as well as their interactions.
The visual mechanisms of vision are simulated by a spatio-temporal filter bank. A decomposition is then used to account for phenomena as contrast sensitivity and masking. Once the amount of distortions perceived is known, quality estimation can be assessed at various levels.
VIF: Visual Information Fidelity 13
VIF is built on the premise that quality is complementary to the measure of information fidelity loss. The VIF score is measured as a loss of fidelity combining four different spatial scales. It quantifies the loss of image information to the distortion process, and explore the relationship between image information and visual quality. VIF quantifies the information that is present in the reference image, and also quantify how much of this reference information can be extracted from the distorted image.
DLM: Detail Loss Metric 14
DLM separately evaluates detail losses (loss of useful visual information which affects the content visibility) and the additive impairment (the redundant visual information whose appearance in the test image will distract viewer’s attention from the useful contents causing unpleasant viewing experience). The outputs of detail loss and additive impairment are adaptively combined to yield the overall DLM quality measure. DLM had better if not equal results than PSNR, SSIM or VIF during comparisons 14.
MOVIE: Motion tuned spatio-temporal quality assessment of natural videos 15
This metric aims to evaluate the effect of motion on visual quality.
It considers two separate components. It evaluates the spatial quality with a method loosely inspired by the SSIM index and emporal quality using motion information from the reference video sequence (via pixel changes). The spatial and temporal quality scores are combined to obtain an overall video integrity score known as the MOVIE index. Note that it only considers the luminance domain.
ST-MAD: A spatiotemporal most apparent distortion model for video quality assessment 16
Spatiotemporal Most Apparent Distortion (MAD)17 extends a previous paper from the same author17. ST-MAD estimates motion-based distortion by applying MAD’s appearance-based model (see below).
Local luminance and contrast masking are used to estimate detection-based perceived distortion in high-quality images, whereas changes in the local statistics of spatial-frequency components are used to estimate appearance-based perceived distortion in low-quality images.
ST-MAD uses multiple strategies to determine image quality:
- For images containing near-threshold distortions, the image is most apparent, and thus the human visual system (HVS) attempts to look past the image and look for the distortions (a detection-based strategy).
- For images containing clearly visible distortions, the distortions are most apparent, and thus the human visual system (HVS) attempts to look past the distortion and look for the image’s subject matter (an appearance-based strategy).
It is then adjusted with weights which take in account the human visual system (HVS) tendency to be more affected by fast-moving regions located toward the center of the video.
VQM: Video quality metric 18
VQM is an algorithm that uses a neural network model to fuse low-level features into a final metric.
The Video Quality Metric (VQM) has been developed by Institute for Telecommunication Sciences (ITS), the research laboratory of the National Telecommunications and Information Administration (NTIA) (USA). It was standardized by the ITU for SDTV (ITU-T Rec. J.144), but has shown very good performance, especially the updated version VQM for variable frame delay (VQM-VFD). However, Netflix's evaluation put VMAF slightly ahead of VQM-VFD. The problem for both of these models (and the other top models) is that distribution quality video spans a small range of quality.
VMAF: Video multi-method assessment fusion 19
VMAF is a quality metric developed by Netflix in cooperation with the University of Southern California, The IPI/LS2N lab University of Nantes, and the Laboratory for Image and Video Engineering (LIVE) at The University of Texas at Austin.
VMAF uses existing image quality metrics and other features to predict video quality:
- Visual Information Fidelity (VIF)
- Detail Loss Metric (DLM)
- Mean Co-Located Pixel Difference, it measures temporal difference (motion) between frames on the luminance component.
The metrics are combined with SVM-based regression to provide a single output score in the range of 0–100 per video frame (100 being quality identical to the reference video). These scores are then combined for the whole video to provide an overall differential mean opinion score (DMOS).
VMAF is similar to VQM in spirit, but VQM extracts features at lower levels such as spatial and temporal gradients. Since the VMAF approach allows for incorporation of new elementary metrics into its framework, VQM could serve as an elementary metric for VMAF as well.19
Reduced reference methods
In these methids only limited features from a reference image instead of the complete image are used to evaluate the quality of distorted image.
FSI: Free-energy principle and Sparse Representation 20
FSI is based on the neuroscience free-energy principle and tries to model the perception and understanding of the scene as an active inference process.
FSI is an image quality metric where the reference and distorted images are predicted by the sparse representation at first. Then, the difference between the entropies of the prediction discrepancies is defined to measure the image quality. It claims to have comparative results to PSNR and SSIM compared to subjective testing.
SRR: SSIM Reduced-Reference 21
The SRR value is calculated as the ratio of received (target) video signal SSIM with reference video pattern SSIM values. It uses a ratio (SRR) based on the SSIM measured at the source (provider, where we have the reference) divided by the SSIM at the user side (where we have a reduced reference). It claims to have higher fidelity than SSIM even without reference of 2.56%.
ST-RRED: ST-Reduced Reference Entropic Differencing 22
ST-RRED is an extension of Reduced Reference Entropic Differencing (RRED) and computes wavelet coefficients of consecutive frame differences (temporal RRED) which in conjunction with spatial RRED indices provide a quality value. The spatial and temporal information differences are combined to obtain the reduced reference differences. They adopt a hybrid approach of combining statistical models and perceptual principles.
No reference methods
These algorithms aim to provide a quality metric of an image without the need of any reference image or its features. Due to absence of reference image, one needs to model the statistics of reference image, the nature of the human visual system (HVS) and effect of distortions on the image. It is difficult to evaluate the effectiveness of a quality measure with a specific distorted image in absence of a reference image.
The metrics can be further split up into two broad categories: phenomenological, that analyze features of the image without attempting to understand the fundamentals of the interaction between the human visual system (HVS) and the image, and model-based, that incorporate some more or less accurate representation of the human visual system (HVS) in the assessment algorithm 23.
BRISQUE: No-reference Image Quality Assessment in the Spatial Domain 24
This model doesn't compute distortion-specific features, such as ringing, blur, or blocking, but instead uses scene statistics of locally normalized luminance coefficients to quantify possible losses of “naturalness” in the image due to the presence of distortions, thereby leading to a holistic measure of quality.
No transformation to another coordinate frame (DCT, wavelet, etc.) is required, distinguishing it from prior non-reference approaches.
They claim to achieve better results than full-reference PSNR and SSIM.
NIQE: A Feature-Enriched Completely Blind Image Quality Evaluator 25
In NIQE the authors used statistical features from the images and created a gaussian model of reference images. They calculate the distance between the features of the image to be tested with the model to determine its quality.
NBIQA: A Novel Blind Image Quality Assessment Method Based on Refined Natural Scene Statistics 26
NBIAQ uses selected features from both the spatial and transform domains and Natural Scenes Statistics (NSS) model by selecting competitive features from existing NSS models and adding three new features. Then the refined NSS is fed into Support Vector Machine (SVM) tool to learn a simple regression model.
PSS: Blind Quality Assessment of Compressed Images via Pseudo Structural Similarity 27
The assumption is that distortion would change the structural similarity in the image if heavily distorted. The idea in PSS is to be able to compare the highest compressed image (with theoratically the most compression artifacts) to the image we want to determine the quality level and estimate the distance. Unfortunately I did not find concrete benefits when comparing to other No-reference approaches.
BMPRI: Blind Image Quality Estimation via Distortion Aggravation 28
In BMPRI, multiple pseudo reference images (MPRIs) are created by further degrading the distorted image in several ways and to certain degrees, and then compare the similarities between the distorted image and the MPRIs. Via such distortion aggravation, they create some kind of reference image, i.e., the MPRIs, and utilize the full-reference to extract local binary pattern features to "grade" the the similarities between the distorted image and the MPRIs. The similarity scores are then utilized to
estimate the overall quality.
DIIVINE: Distortion Identification-based Image Verity and Integrity Evaluation 29
DIIVINE operates based on real-valued wavelet coefficients, whereas the visual appearance of an image can be strongly determined by both the magnitude and phase information.
It assesses image quality based on the complex Gaussian scale mixture model corresponding to the complex version of the steerable pyramid wavelet transform as these distributions have characteristic shapes that are consistent across different natural images but change significantly in the presence of distortions.
BLIINDS: No-reference image quality assessment based on local
magnitude and phase statistics of natural scenes 30
The approach relies on a spatio-temporal model of video scenes in
the discrete cosine transform domain, and on a model that characterizes the type of motion occurring in the scenes, to predict video quality.
BLIINDS outperforms the NIQE index and the full-reference PSNR and SSIM measures. Video BLIINDS does not quite attain the performance level of state-of-the-art full-reference VQA measures, (MOVIE and ST-MAD), but its performance is nearly as good and with much less computational cost.
Sources
011006, 2010. PDF
-
Brunnström, K., A. Djupsjöbacka, and B. Andren (2021). Objective video quality assessment methods for Video assistant refereeing (VAR) Systems. Tech. rep. RISE report 2021:30. RISE Research Institute of Sweden AB. PDF ↩
-
Pinson, M. H., & Wolf, S. (2003, June). Comparing subjective video quality testing methodologies. In Visual Communications and Image Processing 2003 (Vol. 5150, pp. 573-582). SPIE. PDF ↩
-
Dost, S., F. Saud, M. Shabbir, M. G. Khan, M. Shahid, and B. Lovstrom (2022). “Reduced reference image and video quality assessments: review of methods”. EURASIP Journal on Image and Video Processing 2022:1, pp. 1–31. PDF ↩
-
Lin, X., H. Ma, L. Luo, and Y. Chen (2012). “No-reference video quality assessment in the compressed domain”. IEEE Transactions on Consumer Electronics 58:2, pp. 505–512. PDF ↩
-
Teo, P. and D. Heeger (1994). “Perceptual image distortion”. In: IEEE International Conference on Image Processing, Austin, TX, 982–986 vol.2. PDF ↩
-
Wang, Z., A. Bovik, H. Sheikh, and E. Simoncelli (2004). “Image quality assessment: from error visibility to structural similarity”. IEEE Transactions on Image Processing 13:4, pp. 600–612. PDF ↩
-
Multi-scale Structural Similarity for Image Quality Assessment (MS-SSIM), IEEE Asilomar Conference on Signals, Systems and Computers, 2003, Wang Z et al. PDF ↩
-
FSIM: A Feature Similarity Index for Image Quality Assessment (FSIM), IEEE TIP, 2011, Zhang L et al. PDF ↩
-
Information Content Weighting for Perceptual Image Quality Assessment (IW-SSIM), IEEE TIP, 2010, Wang Z et al. PDF ↩
-
. Wang and A. Bovik, “A universal image quality index,” IEEE Signal Proces. Lett., vol. 9, no. 3, pp. 81–84, Mar. 2002. PDF ↩
-
. Chandler and S. Hemami, “VSNR: A wavelet-based visual signal-to-noise ratio for natural images,” IEEE transactions on image processing, vol. 16, no. 9, pp. 2284–2298, 2007. PDF ↩
-
C. J. Branden Lam brecht and O. Verscheu re. “Perceptual Quality Measure using a Spatio-Temporal Model of the Human Visual System,” Proc. SPIE Vol. 266 8, p. 450-461, March, 1996. PDF ↩
-
H. Sheikh and A. Bovik, “Image information and visual quality,” IEEE Transactions on image processing, vol. 15, no. 2, pp. 430–444, 2006. PDF ↩
-
S. Li, F. Zhang, L. Ma, and K. Ngan, “Image Quality Assessment by Separately Evaluating Detail Losses and Additive Impairments,” IEEE Transactions on Multimedia, vol. 13, no. 5, pp. 935–949, Oct. 2011. PDF ↩
-
K. Seshadrinathan and A. C. Bovik, “Motion tuned spatio-temporal quality assessment of natural videos” IEEE Trans. Image Process., vol. 19, no. 2, pp. 335–350, Feb. 2010. PDF ↩
-
P. V. Vu, C. T. Vu, and D. M. Chandler, “A spatiotemporal most apparent distortion model for video quality assessment” in Proc. IEEE ICIP, Sep. 2011, pp. 2505–2508. PDF ↩
-
Eric C. Larson and Damon M. Chandler, “Most apparent distortion: full-reference image quality assessment and the role of strategy,” Journal of Electronic Imaging, vol. 19, no. 1, pp. ↩
-
ITU-T (2004). Objective perceptual video quality measurement techniques for digital cable television in the presence of full reference (itu-t rec. j.144). https://www.itu.int/rec/T-REC-J.144-200403-I. ↩
-
Li, Z., A. Aaron, I. Katsavounidis, A. Moorthy, and M. Manohara (2016b). Toward a practical perceptual video quality metric. url: https: //netflixtechblog.com/toward-a-practical-perceptual-video-quality-metric- 653f208b9652. ↩
-
Reduced-reference Image Quality Assessment in Free-energy principle and Sparse Representation (FSI), IEEE TMM, 2017, Liu Y et al. PDF ↩
-
Kourtis, M.-A.; Koumaras, H.; Liberal, F. (July–August 2016). "Reduced-reference video quality assessment using a static video pattern". Journal of Electronic Imaging. 25 (4): 043011. PDF ↩
-
Soundararajan, R.; Bovik, A.C. (2013-04-04). "Video Quality Assessment by Reduced Reference Spatio-Temporal Entropic Differencing". IEEE Transactions on Circuits and Systems for Video Technology. 23 (4): 684–694. PDF ↩
-
Zhai, G. and X. Min (2020). “Perceptual image quality assessment: a survey”. Science China Information Sciences 63:11, pp. 1–52. PDF ↩
-
No-reference Image Quality Assessment in the Spatial Domain (BRISQUE), IEEE TIP, 2012, Mittal A et al. PDF ↩
-
A Feature-Enriched Completely Blind Image Quality Evaluator (IL-NIQE), IEEE TIP, 2015, Zhang L et al. PDF ↩
-
A Novel Blind Image Quality Assessment Method Based on Refined Natural Scene Statistics (NBIQA), IEEE ICIP, 2019, Ou F Z et al. PDF ↩
-
Blind Quality Assessment of Compressed Images via Pseudo Structural Similarity (PSS), IEEE ICME, 2016, Min X et al. PDF ↩
-
Blind Image Quality Estimation via Distortion Aggravation (BMPRI), IEEE TBC, 2018, Min X et al. PDF ↩
-
Zhang, Moorthy, A. K., Chandler, D., & Bovik, A. (2014). C-DIIVINE: No-reference image quality assessment based on local magnitude and phase statistics of natural scenes. Sig. Proc. Image Commun., 29(7). PDF ↩
-
Saad, M., Bovik, A. C., & Charrier, C. (2014). Blind prediction of natural video quality. IEEE Trans. on Image Proc., 23(3), 1352-1365. PDF ↩

Top comments (0)