Nebula Explorer is a visualization tool of the Nebula Graph ecosystem. With it, you can easily access Nebula Graph, and then query and retrieve graph data via GUI without having to learn nGQL. It can display graph data as a graph on a canvas for you to visually analyze data.
Querying Graph Data
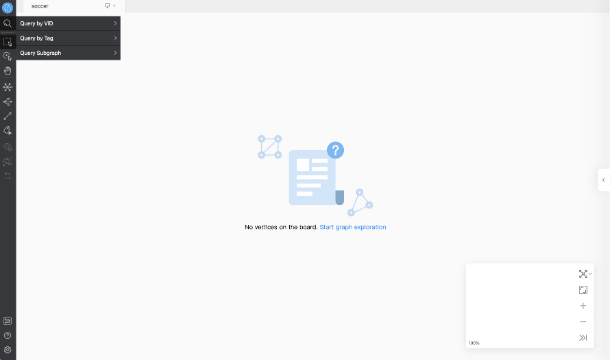
Nebula Explorer provides various methods for querying graph data. For example, you can specify a VID list or tags (with their indexes) to query vertices, or specify one or more VIDs to query a subgraph. When the queried vertices are retrieved, you can select one or more for further exploration. For example, you can query for the shared neighbors and the related paths of each pair of vertices. Through progressive queries, you can improve and enrich the data on the canvas for further graph analysis.

Displaying Graph Data
When the graph data is retrieved, you can manipulate it on the canvas flexibly, including drag-and-drop, zoom-in or zoom-out, click-and-drag, and marking vertices with colors or icons. Nebula Explorer enables you to have fun with the graph data model by providing various features.

Roadmap
Besides querying and exploring data, Nebula Explorer will support graph computing in the future, which will enable the Nebula Graph users to use appropriate methods to query and analyze graph data in various business scenarios.
Currently, Nebula Explorer is only available for Enterprise users. If you are interested, please send an email with “Require Dashboard” as the subject to inquiry@vesoft.com.
If you encounter any problems in the process of using Nebula Graph, please refer to Nebula Graph Database Manual to troubleshoot the problem. It records in detail the knowledge points and specific usage of the graph database and the graph database Nebula Graph.

Top comments (0)