
Written by Abiola Farounbi
✏️
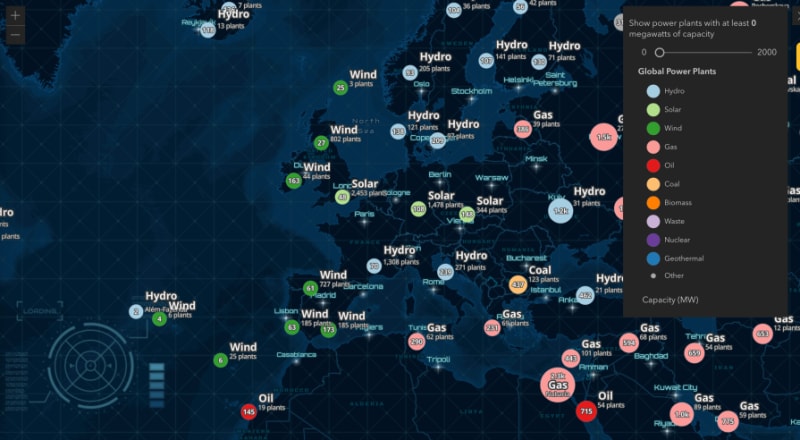
Maps play an important role in various applications and websites, aiding in presenting data, assisting users in finding physical locations, and improving overall user interaction. Whether it's displaying your business location, country statistics, or travel destinations, maps offer an interactive way to convey information.
Prearranged maps save time for users searching for physical locations, making them an integral part of many applications. To bring these maps to life, various mapping libraries and APIs have emerged, each offering a distinct set of features tailored to specific use cases. However, integrating maps into your application requires thoughtful consideration of the available options.
Before embarking on this journey, it's crucial to evaluate different mapping libraries and APIs against specific criteria. In this article, we will delve into a comprehensive exploration of some popular JavaScript mapping APIs, providing detailed comparisons to aid you in making informed choices for your development endeavors.
Overview of mapping APIs in JavaScript
Mapping APIs in JavaScript offers a powerful way to bring maps to life within web browsers, enabling developers to create dynamic and engaging experiences centered around spatial data. These APIs provide a toolkit of features that allow you to:
- Visualize geographic information: Display maps from various providers, layer your spatial data and customize map styles to suit your needs
- Interact with maps: Enable users to zoom, pan, explore different map views, and interact with map elements like markers, popups, and tooltips
- Calculate routes and directions: Plan trips, provide navigation instructions, and visualize routes between locations
- Geocode and reverse geocode: Convert addresses into map coordinates and vice versa, seamlessly linking real-world locations to your web applications
- Perform spatial analysis: Utilize tools to measure distances, and areas, and conduct spatial queries, unlocking insights from geographic data
In this article, we will be exploring five prominent JavaScript mapping APIs:
- Leaflet
- Mapbox GL JS
- OpenLayers
- ArcGIS
- Google Maps
The selection of these mapping APIs is based on adoption rate, their prominence within the developer community, and versatility across diverse use cases. We will delve into the essential factors to consider when choosing a mapping API for your JavaScript project, including features, performance, and integration.
5 top JavaScript mapping APIs
Leaflet
 Leaflet stands out as one of the top open source JavaScript libraries for crafting interactive maps. Optimized for both mobile and web devices, it is relatively small (around 42KB) and offers a ton of features, plugins, and a straightforward API. It works across all browsers and platforms.
Leaflet provides core map elements such as tile layers, markers, pop-ups, polylines, polygons, and circles, enabling seamless map interactions. It allows users to toggle between different map layers for enhanced data visualization, and it offers extensive customization options to tailor map styles, markers, and controls to match your application's design and UX goals.
Leaflet supports various tile providers as the base map, including popular options like OpenStreetMap, Mapbox, and more. It also has a rich ecosystem of plugins that expand its functionality to cater to diverse mapping needs.
Leaflet is freely available for both personal and commercial use, fostering a vibrant community of developers and users who contribute to its ongoing development and support. Its small footprint contributes to fast loading times, making it suitable for web apps that prioritize performance.
Leaflet seamlessly integrates into web applications either directly from npm or through a CDN.
Here is a JavaScript implementation that utilizes Leaflet to showcase a map using OpenStreetMap tiles:
var map = L.map('map').setView([51.505, -0.09], 13);
L.tileLayer('https://{s}.tile.openstreetmap.org/{z}/{x}/{y}.png', {
attribution: '© <a href="https://www.openstreetmap.org/copyright">OpenStreetMap</a> contributors'
}).addTo(map);
Mapbox GL JS
 Mapbox GL JS is a robust JavaScript library designed to create interactive and visually captivating maps for the web. It leverages the power of Mapbox GL, a graphics library built on OpenGL for dynamic rendering of both 2D and 3D maps directly in compatible web browsers.
By prioritizing client-side rendering and asynchronous loading, Mapbox GL JS offers unparalleled flexibility and performance for crafting compelling map experiences.
The library stands out for its features, such as its highly performant vector maps, which guarantee seamless rendering and swift interactions even when handling extensive datasets and complex visualizations. The platform's offline support ensures map functionality without an internet connection, enhancing accessibility across various scenarios.
Beyond its foundational features, Mapbox GL JS provides advanced capabilities such as 3D maps, terrain visualization, heatmaps, and clustering.
Mapbox GL JS provides access to extensive Mapbox tilesets that contain a substantial volume of geographic data. Alternatively, it also offers the flexibility to use custom tile sources.
In terms of performance, Mapbox GL JS is optimized for speed and efficiency, delivering smooth map interactions even with large datasets. Its relatively small file size minimizes the impact on page load times, contributing to an enhanced user experience.
Here is a JavaScript implementation that utilizes Mapbox GL to showcase a map:
mapboxgl.accessToken = '<your access token here>';
const map = new mapboxgl.Map({
    container: 'map', // ID of the container element
    style: 'mapbox://styles/mapbox/streets-v12', // URL of the map style
    center: [-74.5, 40], // Initial position [longitude, latitude]
    zoom: 9 // Initial zoom level
});
OpenLayers
 OpenLayers is a modular, high-performance library designed for displaying and interacting with maps and geospatial data. It is a free, open-source JS library released under the 2-Clause BSD License, facilitating the creation of interactive and feature-rich web maps.
It supports a wide range of free and commercial image and vector tile sources, along with popular open and proprietary vector data formats. With support for tiled layers, it seamlessly pulls tiles from various sources like OSM, Bing, Mapbox, Stadia Maps, and other XYZ sources.
The library excels at rendering vector data from diverse formats, including GeoJSON, TopoJSON, KML, GML, and Mapbox vector tiles. Leveraging cutting-edge technologies such as Canvas 2D, WebGL, and HTML5, OpenLayers ensures high-performance map interactions, with inbuilt mobile support and the ability to create lightweight custom profiles tailored to specific needs.
Its flexibility extends to customization and extension, allowing straightforward CSS styling of map controls and the incorporation of third-party libraries for extended functionality. Its modular architecture enables developers to include only the necessary features, minimizing file size and impact on loading times.
It's important to note that the library has a steeper learning curve compared to simpler alternatives like Leaflet, and while abundant community resources exist, official support options are limited, especially compared to commercially licensed libraries.
OpenLayers is available via the ol npm package, offering developers a powerful toolkit for creating sophisticated maps. Here is a JavaScript implementation that utilizes OpenLayers to showcase a map:
import Map from 'ol/Map';
import View from 'ol/View';
import TileLayer from 'ol/layer/Tile';
import XYZ from 'ol/source/XYZ';

new Map({
  target: 'map',
  layers: [
    new TileLayer({
      source: new XYZ({
        url: 'https://tile.openstreetmap.org/{z}/{x}/{y}.png'
      })
    })
  ],
  view: new View({
    center: [0, 0],
    zoom: 2
  })
});
ArcGIS
 The ArcGIS API for JavaScript, now recognized as the ArcGIS Maps SDK for JavaScript, stands as a lightweight solution for seamlessly embedding maps within web applications.
Developed and maintained by Esri, a renowned leader in geographic information systems (GIS), this API offers a wealth of features, samples, bundled widgets, and templates. It is designed to work optimally within the ArcGIS system; the SDK provides comprehensive GIS capabilities for developers building mapping and spatial analysis applications for the web.
The platform supports an extensive range of map elements, including tile layers, markers, pop-ups, lines, polygons, raster data, and 3D models, enabling rich spatial visualizations. It also includes interactive features such as zooming, panning, querying, selecting, measuring, and performing spatial analysis. ArcGIS provides comprehensive customization options, from map styles to layout design, allowing users to create visually compelling and informative maps.
It is well-suited for organizations requiring enterprise-level GIS solutions, including server-based infrastructure, data management, and collaborative workflows. Access to the library is not completely free as it is based on a commercial licensing model, with various options available for personal, organizational, and enterprise use.
The ArcGIS Maps SDK for JavaScript can be loaded from either AMD modules or ES modules. Once the modules are loaded, they are passed as parameters to the callback function, allowing you to use them in your application.
Here is a JavaScript implementation that utilizes ArcGIS API to showcase a map:
const map = new Map({
  basemap: "arcgis/topographic" // basemap styles service
});

const view = new MapView({
  map: map,
  center: [-118.805, 34.027], // Longitude, latitude
  zoom: 13, // Zoom level
  container: "viewDiv" // Div element
});
Google Maps
 The Google Maps API is a powerful library developers can use to seamlessly integrate immersive and customized map experiences into their applications. It has the benefit of utilizing Google's extensive global data and advanced technology. It also extends beyond traditional mapping capabilities by offering various location-based functionalities.
Leveraging Google's global infrastructure ensures that maps are delivered with speed, reliability, and scalability. It provides developers with a versatile solution to enhance their applications with dynamic mapping capabilities and customization.
The platform boasts diverse services encompassing real-time traffic updates, place search with autocomplete, geocoding, reverse geocoding, Street View imagery, distance and time matrix calculations, elevation data, interactive map controls, and location sharing.
For most users, integration of Google Maps is free, with a monthly credit of $200 per account applicable to any service; in the long run, you would likely incur additional costs.
You can load the library via:
- Dynamic Library Import, which is the recommended method
- The js-api-loader package on npm
- The direct script loading tag
Once the library is successfully loaded, it can be added using the map class as demonstrated below. Here is a JavaScript implementation that utilizes Google Maps API to showcase a map:
map = new Map(document.getElementById("map"), {
  zoom: 4,
  center: position,
  mapId: "DEMO_MAP_ID",
});
Comparison table
Navigating different mapping libraries can be a daunting task; the optimal choice will depend on factors such as project complexity, desired features, and learning curve. To facilitate a well-informed decision-making process, presented below is a comparative analysis of the libraries. Each option excels in distinct areas and features:
| ArcGIS API | Leaflet | Mapbox GL JS | Google Maps | OpenLayers | |
|---|---|---|---|---|---|
| Open source | ❌ | ✅ | ✅ | ❌ | ✅ |
| Pricing | Commercial | Free | Freemium | Free with limits, paid for commercial | Free |
| Free usage limits | 2M tiles/mo. | None | 50K static map requests/mo. | $200 monthly credit | None |
| Documentation | ⭐⭐⭐ | ⭐⭐ | ⭐⭐ | ⭐⭐⭐ | ⭐⭐ |
| Popularity | 8K weekly npm downloads | 950K weekly npm downloads, 6K GitHub stars | 1M+ weekly npm downloads, 2.2K GitHub stars | 1M+ weekly npm downloads | 196K weekly npm downloads, 3K GitHub stars |
| Releases and updates | Updates monthly, major releases annually | Updates biweekly, major releases quarterly/biannually | Updates biweekly, major releases quarterly/biannually | Updates monthly, major releases annually | Updates monthly, major releases annually |
| Strengths | Advanced spatial analysis, enterprise-level features | Lightweight, easy to learn | Performance, customizable maps | Global coverage, rich features, user-friendly | Open source, extensive functionalities |
| Weaknesses | Complex learning curve | Limited features for complex projects | Strict data standardization | Limited customization | Complex learning curve |
| Best use cases | Professional GIS, enterprise solutions | Simple web maps, rapid prototyping | Customizable maps, performance-critical apps | Wide range of consumer and business applications | Complex mapping projects, GIS integrations |
Conclusion
Choosing the ideal JavaScript mapping API boils down to striking a balance between your project's needs, budget, and desired level of customization.
While Google Maps boasts unparalleled global coverage and user-friendly features, its pricing structure can be a significant hurdle for many projects. Conversely, Mapbox offers a more budget-friendly alternative with impressive performance and customization options, though its global reach might not be quite as extensive.
Open source options like Leaflet and OpenLayers provide excellent flexibility and control for developers who value freedom and customization but may require more upfront investment in learning and development. ArcGIS API, on the other hand, caters specifically to professional GIS applications with its powerful spatial analysis tools and enterprise-level features. Still, its commercial licensing makes it less accessible for smaller projects.
Ultimately, the best mapping API for your JavaScript project is the one that aligns with your specific requirements and constraints. Consider your budget, desired features, technical expertise, and project goals before making your decision. By carefully weighing the pros and cons of each option, you will be well-equipped to choose the right mapping API.
Are you adding new JS libraries to build new features or improve performance? What if they’re doing the opposite?
There’s no doubt that frontends are getting more complex. As you add new JavaScript libraries and other dependencies to your app, you’ll need more visibility to ensure your users don’t run into unknown issues.
LogRocket is a frontend application monitoring solution that lets you replay JavaScript errors as if they happened in your own browser so you can react to bugs more effectively.
LogRocket works perfectly with any app, regardless of framework, and has plugins to log additional context from Redux, Vuex, and @ngrx/store. Instead of guessing why problems happen, you can aggregate and report on what state your application was in when an issue occurred. LogRocket also monitors your app’s performance, reporting metrics like client CPU load, client memory usage, and more.
Build confidently — start monitoring for free.

Top comments (0)