
Written by Kingsley Ubah✏️
Software development starts with identifying needs and analyzing requirements before designing and developing the software itself. After development comes testing, deployment, and maintenance.
The testing stage is when we run the code in a development environment, check for possible errors and bugs, fix them, and ensure that the software performs its intended functions correctly before deployment.
Logging is an important part of software testing. It is much easier to debug an application when we know what the mistake is and the exact lines in the code where the issue is occurring.
In this article, we will explore various concepts related to logging in Node.js, including seven popular logging libraries and aggregators you can use to make debugging easier. We will cover:
Why logging matters in software testing
Syntax errors — which happen when a piece of code fails to abide by a language’s rules — can be identified at runtime. Your IDE detects and logs these errors on the terminal after you’ve run the code: 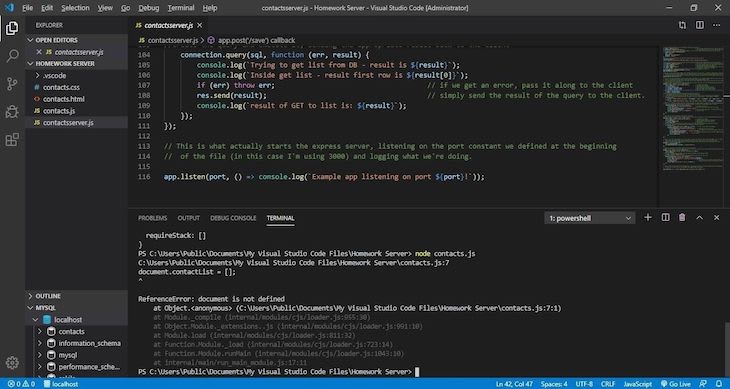
The error message states the issue and identifies the exact lines in the code responsible for the error, giving us all the information we need to resolve the issue.
Unlike syntactic errors, however, logical and runtime errors can’t be identified by an IDE and can be quite difficult to debug. The easiest way to resolve these kinds of errors is by using the logging technique in your program to print messages on the terminal while the program executes.
You can log statements from various places in your code to make debugging easier when an error or bug is encountered. For example, if you’re working with APIs, you can log the API’s response data to inspect the data or ensure the right data structure was returned: 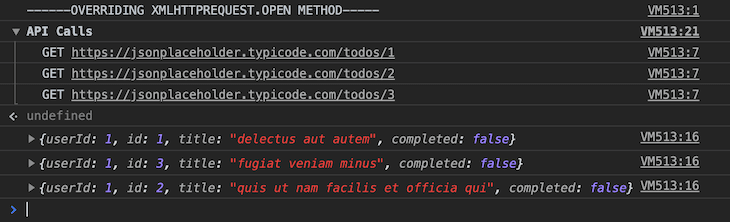
You can also log messages inside the body of your functions. That way, if an error is encountered, you can inspect the logged messages to figure out the functions that ran and those that didn’t run, making it easy to trace from there and debug the code.
Logging in Node.js
It’s important to follow best practices for logging in Node.js to make your debugging work as efficient as possible. Ensure you’re familiar with the various console messages, log levels, and other logging basics as well.
One Node.js logging method is to perform logging inside a middleware via routers and applications, such as this example using Express middleware: 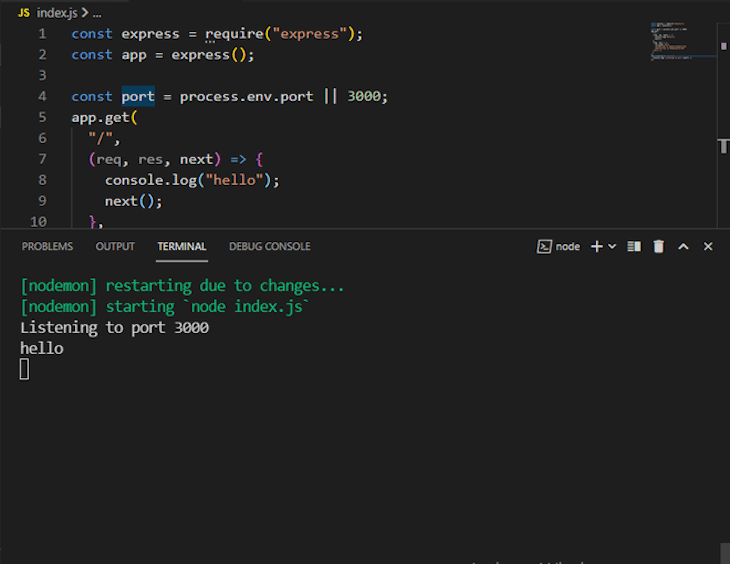 The router can be configured to log requests, responses, errors, and other information that can be used to debug the application.
You can also install third-party logging libraries and aggregators using npm or Yarn.
What is a logging library?
A logging library is a piece of software that can help you generate and manage log data from your application.
The best part of using a third-party logger is that you don’t write the code by yourself. You simply use the appropriate npm or Yarn installation command to install the logger.
Most logging libraries provide support for the most common logging levels such as info, debug, warn, and error. You can create your own custom levels and configure their styles. They also support different modes of transport (file, HTTP, stream, and console).
In the sections below, we will explore some of the best loggers for Node.js, including Grafana Loki, Pino, and more.
Pino
Pino is an excellent Node.js logger option if you want a simple logger that works straight out of the box. Unlike some other logging solutions, Pino doesn’t require much configuration or an external dependency.
A few things that make Pino one of the best Node.js loggers are that it’s free to use, constantly maintained, and packed with a ton of features, including pretty printing, asynchronous logging, transports and log processing, bundling support, and low overhead.
Pino formats log statements using JSON, which makes them easy to read. Supported log levels include debug, warn, error, and info: 
To install using npm, run:
$ npm install pino
To install using Yarn, run:
$ yarn add pino
Once you have successfully installed Pino, you can then import a Pino logger instance into your project. Note that you need to replace the console.log statements with logger.info statements — you can check out the Pino docs for some examples if needed.
You can use Pino with many web frameworks, including Fastify, Express, Koa, Nest.js, Nestify, Happi, and Node core HTTP.
To avoid compatibility issues, we recommend having Node.js v16 or a newer version running locally on your machine before installing the Pino logger. This will guarantee that certain advanced and modern features all function as expected.
Bunyan
Bunyan is a simple, easy-to-use logging library for Node.js applications. It features an elegant log method API, extensible steam systems, serializers, log child, custom rendering of log objects, and a bunyan CLI tool for pretty-printing and filtering Bunyan logs: 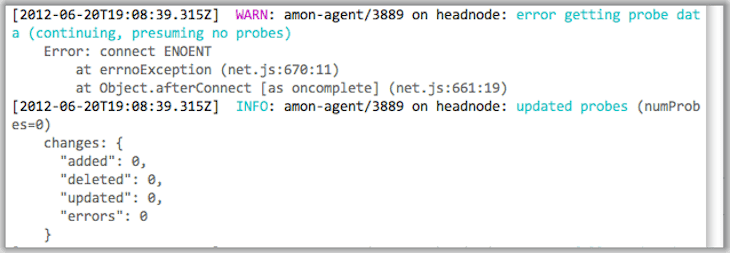
To install using npm, run:
npm install bunyan
Next, create a Logger instance and call methods named after the logging levels:
// server.js

var bunyan = require('bunyan');
var log = bunyan.createLogger({name: 'serverapp'});
log.info('server is active');
log.warn({type: 'error'}, 'something went wrong');
Like Pino and most other logging libraries, Bunyan logs the statements in an easy-to-read JSON format and supports various log levels, including debug, warn, error, and info.
Bunyan supports Node.js, Browserify, Webpack, and NW.js.
It’s important to note that at the time of this writing, Bunyan's official GitHub repository indicates that no maintenance has been carried out on the code in over ten months. This could lead to compatibility issues, especially with newer Node.js releases.
If you’re on Node.js v17 or a newer version, it’s best to go with a regularly maintained logging solution like Pino.js to avoid compatibility issues.
Cabin.js
Cabin.js has more advanced features than the other logging libraries in this list, including:
- Automatic detection and masking of sensitive field names, credit card numbers, Social Security numbers, BasicAuth headers, API keys, and more
- Reduced disk storage cost
- Cross-platform and cross-browser compatibility
- Ability to send logs to an HTTP endpoint, Slack, Sentry, and Papertrail
To get started, install everything you need with npm:
npm install express axe cabin signale
Then, create the quickstart application:
const express = require('express');
const Axe = require('axe');
const Cabin = require('cabin');
const app = express();
const { Signale } = require('signale');

// initialize a new instance of Axe (see below TODO's that appeal to you)
const logger = new Axe({
  logger: new Signale()
});

const cabin = new Cabin({ logger });

app.use(cabin.middleware);

app.get('/', (req, res, next) => res.send('OK'));

// start the server
app.listen(3000);
In the code above, we created an instance of the logger and passed it to Cabin() to create a new cabin object. Then we passed the cabin.middleware property inside of app.use() to set up middleware in your application.
For a detailed guide on how to use Cabin.js, read their official documentation.
Since Cabin.js is way more advanced than the other logging solutions mentioned in this article, it requires extra installations and configurations to work.
The upside to using Cabin.js is that you’re provided with more advanced features that’ll greatly benefit your application, especially around security. The codebase is also regularly maintained, which reduces the risk of compatibility issues with Node.js.
In conclusion, go for Cabin.js if you want a reliable logging solution that offers advanced security features — and if you don’t mind the complexity.
Winston
Winston is a simple and universal logging library that features multiple logging levels, custom logging, multiple transport options, custom transport, exception handling, querying logs, and so much more.
To install Winston with npm, run:
npm i winston
It may be ideal to create your own logger using Winston.createLogger to use Winston:
const winston = require('winston');

const logger = winston.createLogger({
  level: 'info',
  format: winston.format.json(),
  defaultMeta: { service: 'user-service' },
  transports: [
    new winston.transports.File({ filename: 'error.log', level: 'error' }),
    new winston.transports.File({ filename: 'combined.log' }),
  ],
});

if (process.env.NODE_ENV !== 'production') {
  logger.add(new winston.transports.Console({
    format: winston.format.simple(),
  }));
}
This creates a logger with an info logging level and JSON formatting. The logger is then only activated in production. Winston supports different logging levels:
const levels = {
  error: 0,
  warn: 1,
  info: 2,
  http: 3,
  verbose: 4,
  debug: 5,
  silly: 6
};
If you want more information about configuring and using the Winston logger, check out their official docs.
Winston comes with a ton of extra features built in that you might find handy in large projects. They include the following:
- Info objects filtering — Filter out a specific info object when logging, then return a false value
- String interpolation — Join together strings in the log method using
format.splat() - Customize your logging levels — Set background color, font styles, and more
- Exception handling — Catch and log
uncaughtExceptionevents in your application
Winston is an excellent choice if you’re looking for something more advanced. The source code is constantly maintained, so the library works well with all recent Node.js versions. Their documentation is also very detailed and put together very well.
Grafana Loki
Loki is a log aggregation system that stores and queries logs from all your applications and infrastructure. With Grafana logs, you can send and ingest logs in any format (JSON, XML, CSV), from any source (local log files, AWS EC2, Kafta), making it super easy to set up your log system quickly.
Grafana integrates well with Node.js. You can easily use the Grafana dashboard to manipulate data by setting up a Node.js server and Deno project.
To install Grafana Loki in your Node.js project, create a free Grafana Cloud account. When you do this, you won’t need to install, maintain, or scale your own instance of Grafana Loki.
Loki is a cost-effective solution for enterprise Node.js applications. Some of the most useful Grafana log features include:
- Ability to smoothly scale from MB to PB a day if required
- Can handle sudden spikes in query and ingestion load
- Make query logs using the same syntax used for querying metrics
- Write log queries that allow you to dynamically filter and transform your log lines
- Cloud Native (Prometheus, Golang, Grafana & K8S)
Thanks to its minimal index approach, Loki stores the same set of logs in smaller amounts of storage than other enterprise logging solutions. It logs any and all formats, is cheaper to run, easier to run, and performs faster writes and queries.
LogLevel
LogLevel is a simple and lightweight logging library for JavaScript. The library replaces the usual console logging methods, and it’s perfect for the application when in production.
It supports the typical logging levels (trace, debug, info, warn, error) and gracefully falls back to those of the console if more specific ones aren't available.
In terms of functionality, LogLevel is very minimal. It offers the essential logging features you’ll use in your application, but it doesn’t allow you to reconfigure appenders or add complex log filtering rules. You’re better off with Cabin.js or Winston for the more advanced features.
To install LogLevel with npm, run:
npm install loglevel.
To install with Bower instead, run:
bower install loglevel
LogLevel is also available with WebJars and Atmosphere packages for Meteor.
To set it up in Node.js, simply import the library and call any of the regular console logging methods on the object, passing in the message like so:
var log = require('loglevel');
log.warn("unreasonably simple");
For a comprehensive guide on how to use LogLevel, read their official documentation.
Tracer
Tracer is a powerful open source library for Node.js. The logger is very easy to customize, supporting custom loggers and output formats. Its features include:
- Support for all logging levels (log, trace, debug, and so on)
- User-defined logging levels
- Custom formats and filters
- Set different types of transport (log file, stream, MongoDB)
- Provide the stack index for file info
To get started with Tracer, install the package from npm:
npm i tracer
Import the logger before calling your preferred console method or methods:
var logger = require('tracer').console();

logger.log('hello');
logger.trace('hello', 'world');
logger.debug('hello %s',  'world', 123);
logger.info('hello %s %d',  'world', 123, {foo:'bar'});
logger.warn('hello %s %d %j', 'world', 123, {foo:'bar'});
logger.error('hello %s %d %j', 'world', 123, {foo:'bar'}, [1, 2, 3, 4], Object);
The method logs each of these messages on your console. To learn more about Tracer, read its official documentation.
Note that Tracer’s codebase isn’t regularly maintained. At the time of this writing, Tracer’s GitHub repository hasn’t been updated in over a year. This makes compatibility issues possible between Tracer and more recent Node.js versions.
Conclusion
This article covered seven libraries for logging messages in your Node.js application. Logging helps you to detect and diagnose errors, inspect data from API calls and functions, trace the flow of a program's execution, and do so much more.
I hope this article will help you decide which of these popular options for logging in Node.js is best for your needs. If you have any questions, please feel free to comment below.
Get setup with LogRocket's modern Node error tracking in minutes:
1.Visit https://logrocket.com/signup/ to get an app ID.
2.Install LogRocket via NPM or script tag. LogRocket.init() must be called client-side, not server-side.
NPM:
$ npm i --save logrocket

// Code:

import LogRocket from 'logrocket';
LogRocket.init('app/id');
Script Tag:
Add to your HTML:

<script src="https://cdn.lr-ingest.com/LogRocket.min.js"></script>
<script>window.LogRocket && window.LogRocket.init('app/id');</script>
3.(Optional) Install plugins for deeper integrations with your stack:
- Redux middleware
- ngrx middleware
- Vuex plugin

Top comments (0)