Depending on your past experience with CloudWatch, you might have no experience with it at all, you might have used it once or twice when Lambda automatically threw your logs into it, or, like me, this might be the usual view you get of it:
Hundreds of lines of logs and absolute agony to search for anything specific due to the simplistic search function. On top of this, what happens when you have a large number of services, each outputting their logs to a separate log group? Unfortunately Cloudwatch doesn’t allow you to view multiple log groups at once, making it impractical for large-scale applications. This is where a platform such as Insights comes in.
CloudWatch Log Insights is a fully managed service to assist you in searching and visualizing logs that can be piped into CloudWatch from a number of sources including AWS services, EC2 instances, and even external services, all through queries in Insights' new ad-hoc language.
Getting to it
To get started with Insights, open up the Insights page and select the log group you want to run a query on through the dropdown at the top:

Unlike when accessing logs directly through their log group, Insights also allows you to select multiple log groups to run queries on, great for searching across environments or over multiple functions or services!
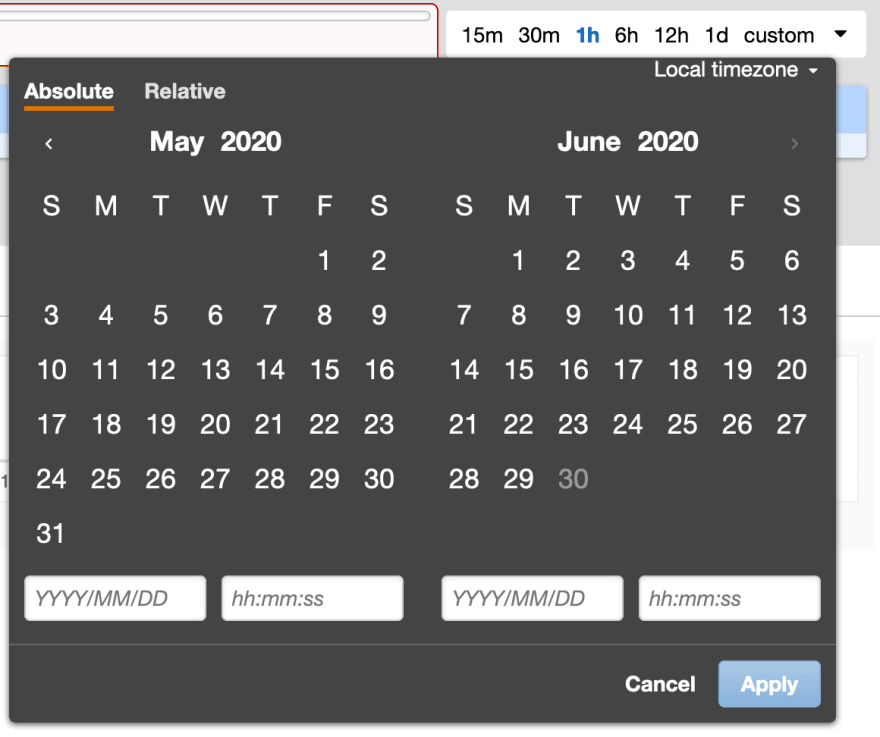
You might also want to select a timeframe if you don't want to stick with the default of showing logs within the last hour. Using the custom dropdown you can enter either an absolute date range, or a relative time. This can be super convenient whether you're debugging an error you've just triggered, or investigating logs around a reported error.
Let's start out with a simple query, and then break it down:
fields @timestamp, @message | sort @timestamp desc | limit 25
fields @timestamp, @message: fetch only the @timestamp and @message fields
|: apply a further command to the result set
sort @timestamp desc: sort by the @timestamp field, descending
limit 25: once 25 results have been fetched, stop searching and return those rows.
So in essence, this query returns the timestamps and messages for the 25 most recent rows in your log group.
Moving onto using the kinds of commands that should really start to get you excited about Insights, statistics!
filter @message like /error/
| stats count(*) as errorCount by bin(1h)
| sort errorCount desc
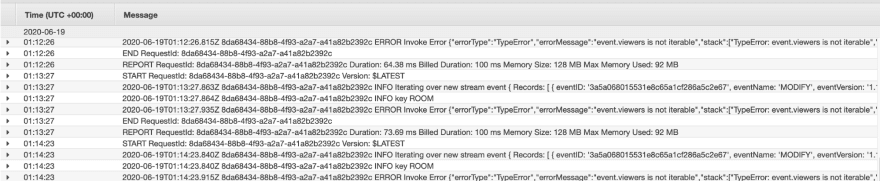
Here we're using the stats command which allows us to pass statistics functions such as max, sum, avg, or in our case, count, meaning each datapoint will be the number of rows containing the string error, grouped by the hour. This query might show you something like this:

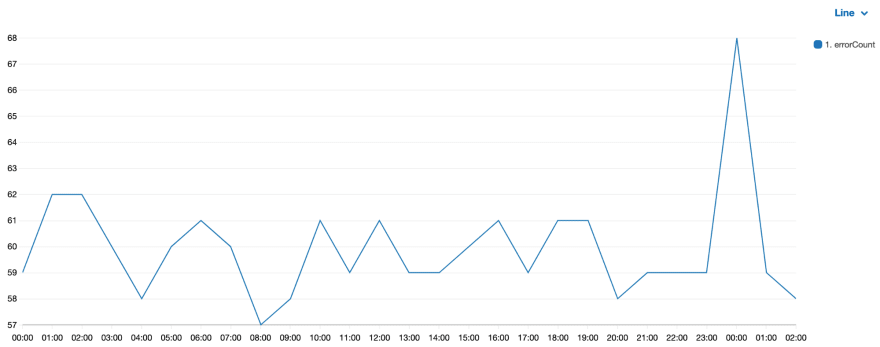
Or if you open up the Visualization tab, you can get a much more useful representation of the data, which can be displayed as a line, bar, or stacked area chart:
Another powerful command you can use is parse, this allows you to parse fields in your logs and translate their contents into columns manipulable within your command:
filter @message like /errorType/
| parse @message '"errorType":"*"' as @errorType
| stats count(@errorType) by bin(1h), @errorType
This command fetches only rows containing the phrase errorType, then parses that field out of the JSON body within the log, mapping it to the @errorType variable, which we can then perform further commands on, such as by counting the number of each type of error, grouped by the hour.
CloudWatch Insights provides a fairly simple solution, saving you from the effort of setting up and managing your own logging solution, while still being powerful and offering most of the core features you'd expect from a logging platform. There are, of course, some drawbacks of Insights, such as the limited visualization capabilities compared to other logging solutions such as an ELK stack. As well as this you have to face up to the requirement of learning a new query language, compared to the more convenient search capabilities provided by some logging solutions.
Hopefully you've now enough information about the capabilities of Cloudwatch Log Insights to navigate your way around the tool. You're now monitoring your application logs much more efficiently, but there’s still a ways to go before you’ve covered everything, and there are plenty other sections of your applications that need to be watched!
Luke writes about AWS and Log Analytics for Coralogix.

Top comments (0)