
Merriam-Webster defines the term "whip-lash" as "injury resulting from a sudden sharp whipping movement of the neck and head." That's how I feel on a regular basis while working my way through a full-stack web development bootcamp. As the knowledge comes in, I race to implement everything I'm learning into a homework assignment or pratice project. Inevitably, during every work session, I hit a wall bringing my workflow to a screaching halt while I power through a couple tutorials on YouTube or comb through documentation.
This rhythm of the learning process is likely (and hopefully) never going to stop. The intervals between full-stops may grow larger but one of the aspects of web and software development that drew me in was the ability to never run out of things to learn. The allure of having a constant stream of new tools and techniques to explore makes me excited for the future.
This process can feel like a roller-coaster, full of ups and downs. The downs can be challenging but the ups make it all worth it. The best kind of "up" is coming across a watershed event, something that completely redefines your level of competency. One such moment, for me, was discovering the power of Chrome dev tools.
Under the browser's hood
Until I started the journey of web development, I never put much thought into my browser. I liked the look and feel of Chrome over Microsoft's browser offerings and so I made it my default a decade or more ago. That is pretty much all the thought I had put into my browser until now.
When we first learned that right clicking and selecting "inspect" on a page in Chrome gave access to a whole new world of data and information, I was intrigued, but didn't quite understand the scope of what this tool allowed me to do. What was apparent to me, though, was that I was looking at the inner workings of an incredibly complex tool that I had always taken for granted. As time has passed and my skills have improved, the dev tools are making their real power known to me and they allow me insight and access into the development process that improves the speed at which I work AND the speed at which I learn.
In this series I will share what I've learned so far about Chrome's dev tools. So right click on your page, select "inspect" and follow along.
FYI - I am aware that other browsers also offer developer tools and that some have features that Chrome doesn't offer. My experience is limited to Chrome's suite of tools and so I will focus on that browser for this series.
Elements tab
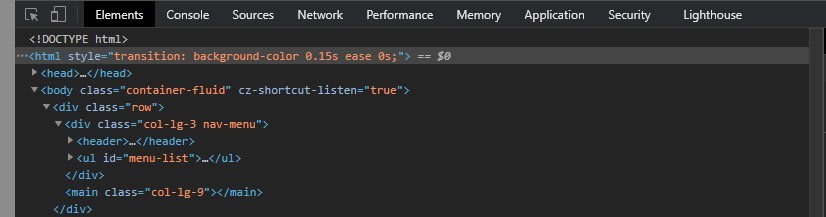
The elements tab is the default view upon opening up Chrome dev tools. It displays the most basic of web-page information, the HTML markup of the currently displayed page. Being able to see how the HTML is formatted while looking at the rendered page made grasping the underlying structure of my pages much easier to understand and plan out. This was especially helpful as I learned how to start using grid frameworks like Bootstrap that significantly increase the amount of elements on my page.
Here are some useful notes on how to use the elements tab:
Hovering
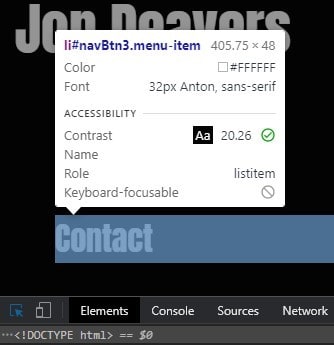
Hovering over an element in the Elements tab will highlight it on the rendered page. This makes tracking down exactly where your elements wind up on the page much easier. In the image above, you can see an icon at the top left corner of the dev tools window that looks like a square with an arrow pointer in it. Clicking on this will let you hover over elements on the rendered page to see information. Clicking on an element in this view will automatically navigate to the Elements window to the corresponding HTML line.
Style Visualization
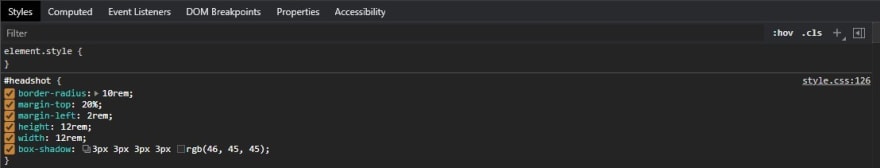
On the right hand side of the Elements tab you will find a second window with even more tabbed options available (see image above). The "Styles" tab will show you any associated CSS that is being applied to the selected element. This is invaluable when trying to figure out if a framework or CSS library is applying a style to your element or if you're trouble-shooting styling on a specific element.
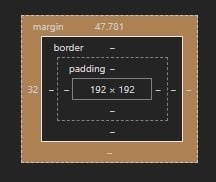
Right beside the "Styles" tab you will find the "Computed" tab. This tab displays a box that visually represents the selected element and notes the amount of margin, border, and padding that is being applied via CSS or natively to that element (see image below).
What's really impressive here is that you can test out changes in your CSS styling right there in Chrome's dev tool. Just click inside the "Styles" tab and add, remove, or modify CSS properties and see their effects applied in real time to the page you have loaded. These changes don't get saved to your files permanently, so it's a great way to test out changes or trouble-shoot styling that isn't quite lining up as expected without breaking your stylesheet. Just remember that you will need to copy these changes to your code editor and save them in your stylesheet in order for them to be permanent. Once you navigate away from the page you loaded, the changes are lost.
Event Listeners
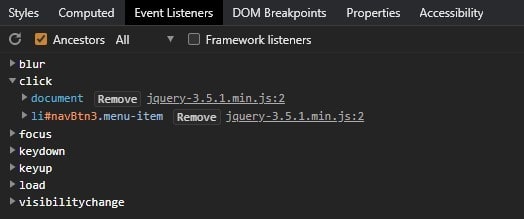
The next tab on our Elements sub-window is the Event Listeners tab. This tab will show any event listeners that are active on the page or a selected element. Event listeners are pieces of code that are "listening" for something to happen in order to trigger something else. A basic example would be button. Buttons have a piece of code attached called a "click listener" that is waiting for the user to click the button and then that listener instructs the broswer to do something else specific after the click is "heard". Sometimes there are different types of listeners on a single element or there are many "listening" elements across the page. Navigating to this tab makes tracking down those listeners and seeing what purpose they serve much easier than scanning through your codebase.
Accessibility
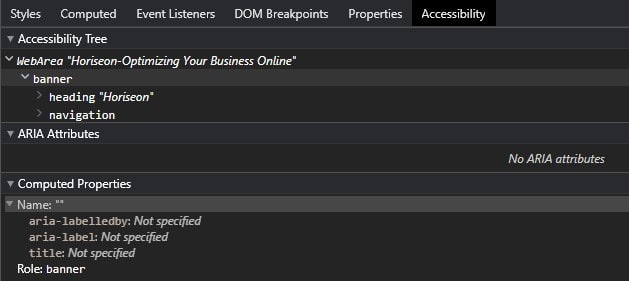
Our very first bootcamp homework assignment was to refactor an HTML page to make it more accessible, paying close attention to "semantic HTML" to improve the ability for tools like screen readers to make sense of the elements on the page. The "Accessibility" tab in the dev tools is a massive time saver for this task.
Elements that are not semantically labeled will return a "generic" descriptor in this section. This provides a road map on how you can take a second look at the elements your page is comprised of and allow you to change their element tags to more accurately reflect their purpose and allow a larger number of people to easily access your content.
"HTMLify" Dynamically Generated Markup
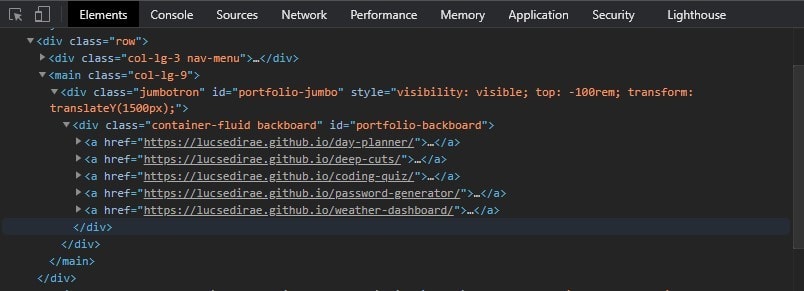
My last tip for the "Elements" tab is probably my favorite. I much prefer to generate my page content dynamically using jQuery and JavaScript over hard-coding HTML. This allows me to have minimal content in my index.html and never navigate away from the main page while still being able to deliver well organized content dynamically. While in the dev tools, the "Elements" tab will display the active HTML that is being rendered on the page even if it was created dynamically outside the HTML file.
In the example above, everything that is shown inside of the "main" element tag was written using jQuery and JavaScript. As the user navigates the menus of my developer profile page, the content of "main" is replaced with different markup. This makes it easy for me to see what my HTML file would look like if it were hard-coded HTML and not dynamic JavaScript.
Summary
Thanks for taking the time to read my post. In the next installment I will take a closer look at the "Console" tab of Chrome's dev tools and really start to dig into the browser's hidden power.
If you would like to see what I've been up to or get in touch, check out my developer profile page on GitHub.

Top comments (0)