In this tutorial, we will make a simple ping tool with Stimulus and Turbo Drive.
Wait, what's a ping?
You may have seen the word ping used as a synonym for latency in online games or network speed tests. But a ping is a program that sends a request to a server to check its availability. It's like calling someone and waiting for them to call us back when they are available.
Using a ping, we can measure the network latency. We can do this by saving the request and response time to compute the difference between the two and display the result in milliseconds.
Usually, a ping uses ICMP (Internet Control Message Protocol), where the request is called ECHO_REQUEST and the response ECHO_REPLY. But we can still use HTTP to ping the server with a GET request and send a plain text response with "PONG", for example.
Ok, but why is it relevant?
With Hotwire, we can build server-side rendered applications. That means the server is responsible for delivering page changes when the client asks for them or in response to events occurred on the server (like when a user sends a message on a chat). The page changes will still have to go through the network to be delivered, whether they get triggered by events on the client or the server.
That's why the network latency is crucial here. The latency is essentially the time it takes for the client to receive a response from the server. It directly influences the time it takes to see the result of an action, so it directly impacts the user experience (especially in server-side rendered applications). The lower latency, the more responsive the pages will feel (and the happier your users will be, hopefully).
The network latency depends on factors like the server load and location. Turbo helps us reduce the server load by allowing us to update the dynamic parts of our pages while efficiently caching the static ones. But this alone is not enough. Even if your application takes advantage of all the features of Turbo, a user connected to a server located in San Francisco from Sydney will still have latency issues. Thankfully, we can use platforms like Fly.io that make it easy to deploy applications close to our users, thus, allowing them to experience the responsiveness of Hotwire applications wherever they are.
Using a ping, we can measure the network latency to help us improve the responsiveness of our Hotwire applications.
Sounds cool, but how are we going to do that?
We will make a ping tool to display the network latency each second on a page. To achieve that, we need to:
- Ping the server by sending a GET request
- Save the request time
- Send the response to the client
- Save the response time
- Compute the difference between the response and request time
- Display the result in milliseconds on the page
- Repeat the process a second later
So let's dive in!
Pinging the server
To ping the server, we can submit a form that sends a GET request to /ping. Then we can render a
plain text response to the client with "PONG" in the body.
Let's generate a PingController:
$ rails g controller ping
Let's add a #pong action which renders a plain text response with "PONG":
class PingController < ApplicationController
  def pong
    render status: :ok, body: "PONG"
  end
end
Let's add a /ping endpoint routed to the #pong action:
Rails.application.routes.draw do
  ...
  get "/ping", to: "ping#pong", as: "ping"
end
Let's create a partial for the form:
# app/views/shared/_ping.html.erb
<%= form_tag ping_path, method: :get do %>
  <%= button_tag "Ping" %>
<% end %>
Let's add the partial to the home page for example:
$ rails g controller home show
# config/routes.rb
Rails.application.routes.draw do
  root to: "home#show"
  ...
end
# app/views/home/show.html.erb
<%= render "shared/ping" >
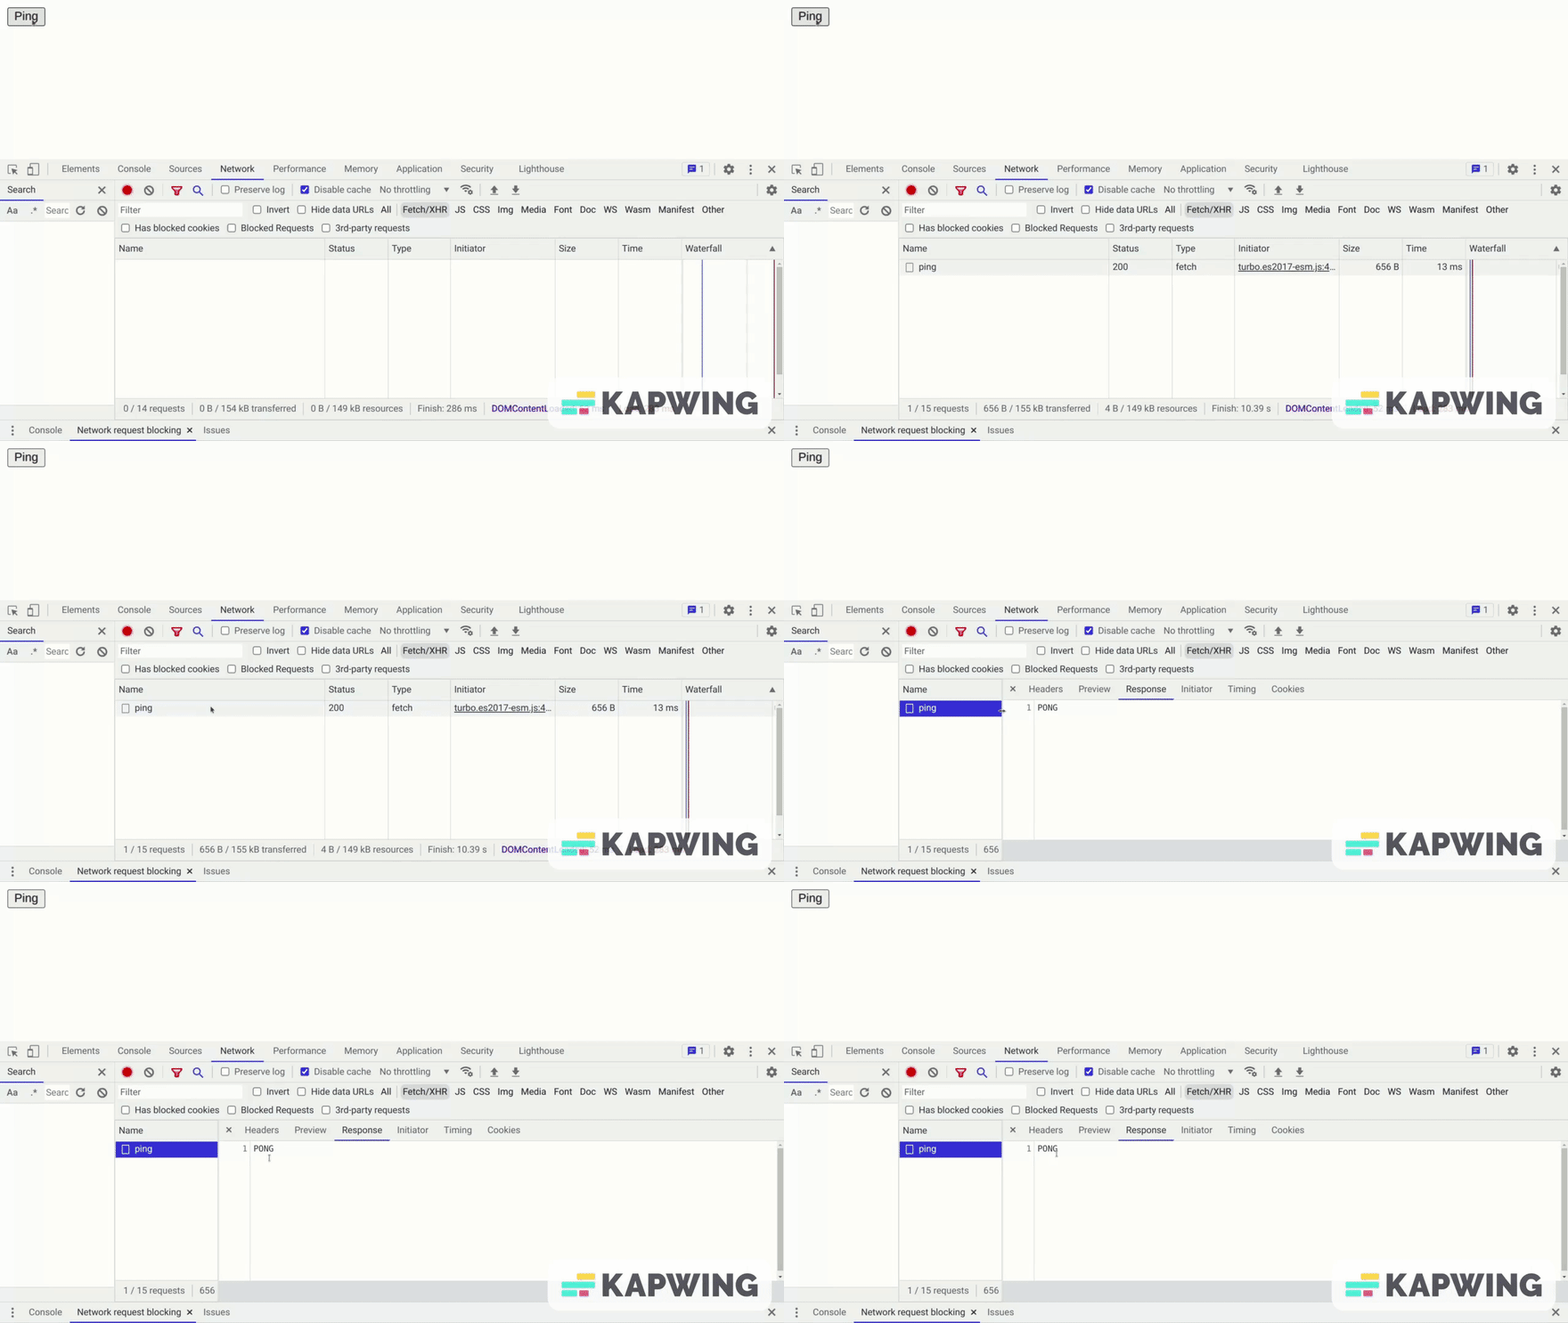
Let's submit the form and inspect the response: 
We have successfully pinged the server. Now we need to measure the network latency.
Measuring the network latency
We can measure the network latency by using Turbo Drive events to:
- Listen to the
turbo:before-fetch-requestevent to pause the request withevent.preventDefault() - Save the request time right after the request is sent
- Resume the request with
event.detail.resume() - Listen to the
turbo:submit-endevent to save the response time and measure the network latency
Let's generate a stimulus controller:
$ rails g stimulus ping
Let's define the getters and setters we will need:
export default class extends Controller {
  // We will write our code here

  get requestTime() {
    return this._requestTime
  }

  set requestTime(requestTime) {
    this._requestTime = requestTime
  }

  get responseTime() {
    return this._responseTime
  }

  set responseTime(responseTime) {
    this._responseTime = responseTime
  }

  get latency() {
    return this._latency
  }

  set latency(latency) {
    this._latency = latency
  }
}
Let's connect the Stimulus controller and define an action to pause the request when the form is submitted:
# app/views/shared/_ping.html.erb
<div data-controller="ping">
  <%= form_tag ping_path, method: :get, data: { action: "turbo:before-fetch-request->pauseRequest" } do %>
    ...
  <% end %>
</div>
The pauseRequest() method should:
- Pause the request using
event.preventDefault() - Save the request time right after the request is sent using
setTimeout() - Resume the request with
event.detail.resume()
# app/javascript/controllers/ping_controller.js
export default class extends Controller {
  pauseRequest(event) {
    event.preventDefault()

    setTimeout(() => this.saveRequestTime() )

    event.detail.resume()
  }

  saveRequestTime() {
    this.requestTime = new Date().getTime()
  }
  ...
}
Note: We used an arrow function to ensure that this resolves to the current controller.
Now let's add an action to measure the network latency when the form is submitted:
# app/views/shared/_ping.html.erb
<div data-controller="ping">
  <%= form_tag ping_path, method: :get, data: { action: "... turbo:submit-end->measureLatency" } do %>
    ...
  <% end %>
</div>
The measureLatency() method should:
- Save the response time
- Compute the difference between the response and request time
- Display the result
export default class extends Controller {
  ...
  measureLatency() {
    this.saveResponseTime()

    this.latency = this.responseTime - this.requestTime

    console.log(`${this.latency} ms`)
  }

  saveResponseTime() {
    this.responseTime = new Date().getTime()
  }
  ...
}
Let's try to submit the form and open the console to see if it works: 
Nice, it worked!
Note: If we inspect the request on Chrome, we can see that the result is close to the total time recorded by the browser. But in other browsers (especially Firefox) we can see that the results can be quite different for some reason.
Displaying the latency each second
To ping the server each second, we can set a timer in measureLatency() to submit the form a second later after the latency is displayed.
First, let's register the form as a Stimulus target:
# app/views/shared/_ping.html.erb
<div data-controller="ping">
  <%= form_tag ping_path, method: :get, data: { ..., "ping-target": "pingForm" } do %>
    ...
  <% end %>
</div>
Then set our timer with setTimeout():
export default class extends Controller {
  static targets = ["pingForm"]
  ...
  measureLatency() {
    ...
    setTimeout(() => this.ping(), 1000)
  }
  ...
  ping() {
    this.pingFormTarget.requestSubmit()
  }
}
Note: We're using form.requestSubmit() because form.submit() doesn't dispatch submit events.
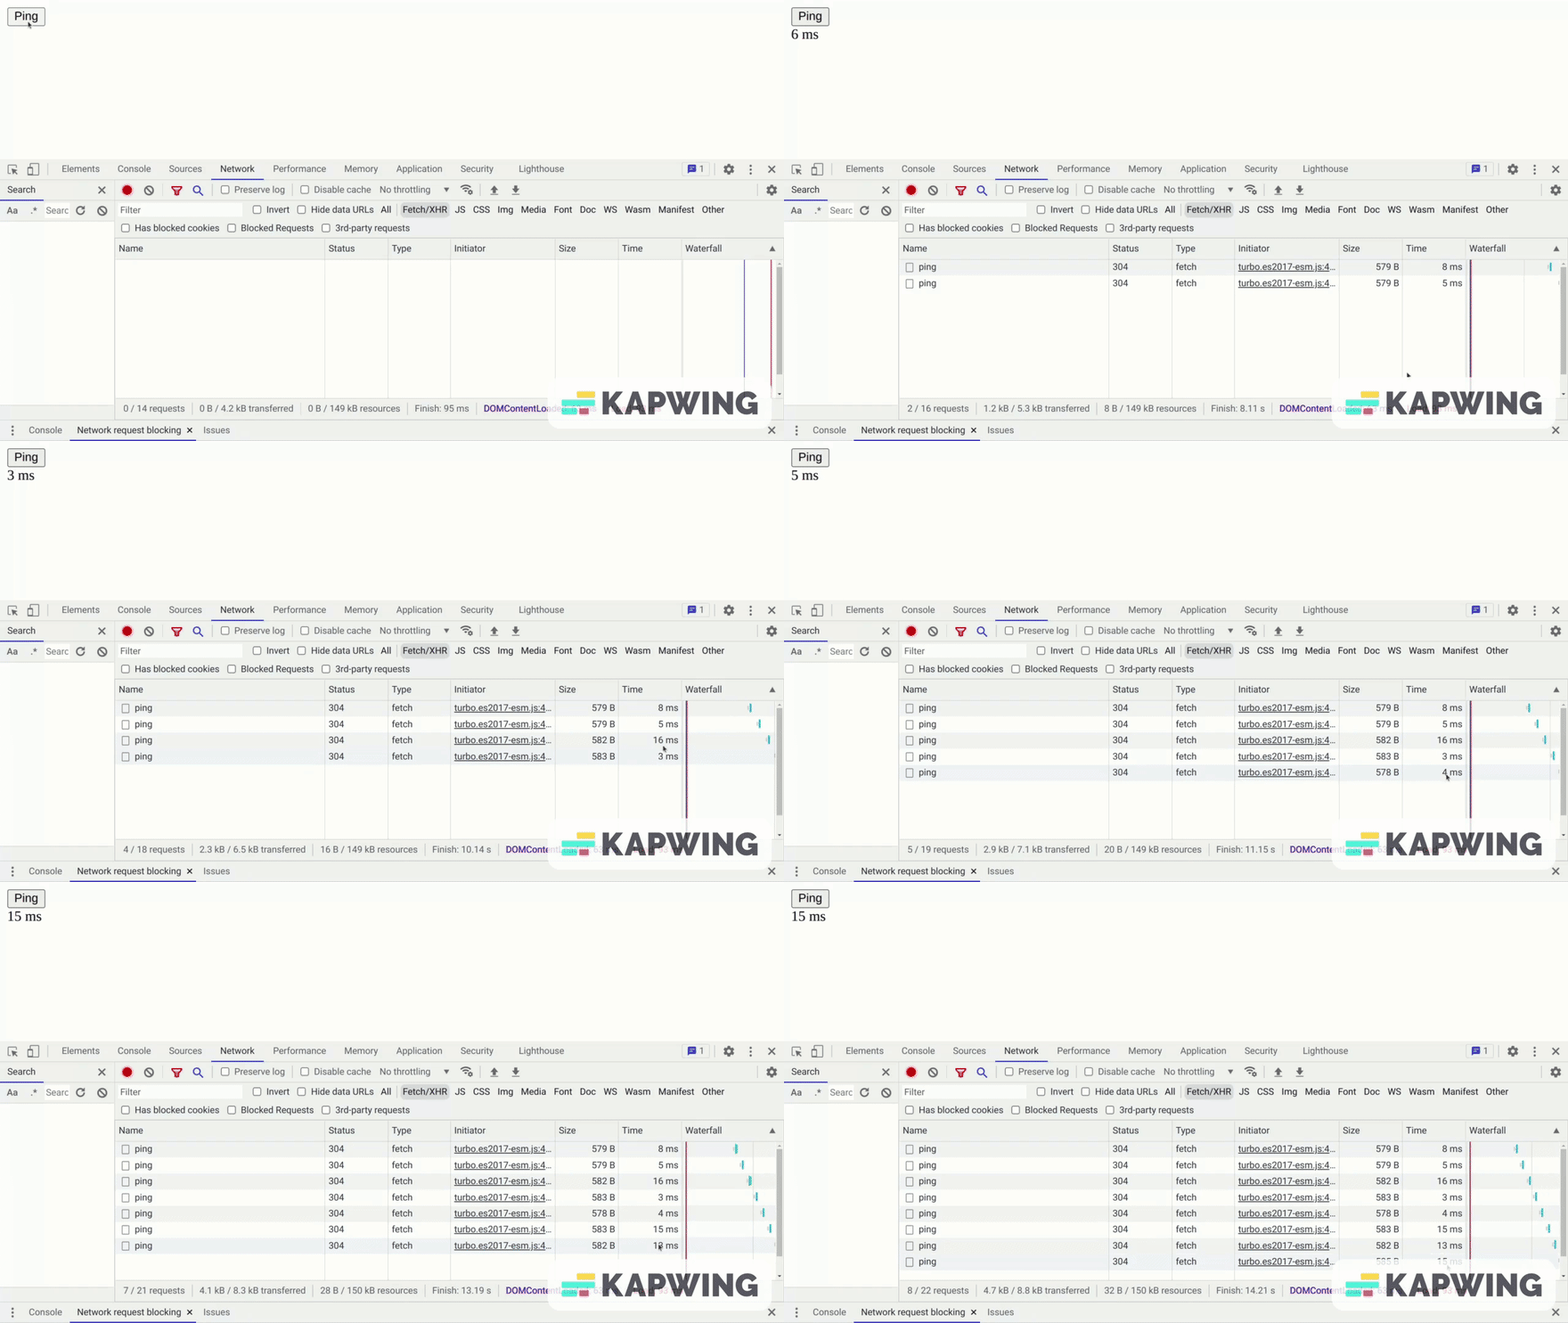
Let's submit the form and open the console: 
It worked! Now let's display the result on the page rather than on the console:
# app/views/shared/_ping.html.erb
<div data-controller="ping">
  ...
  <span data-ping-target="latency"></span>
</div>
export default class extends Controller {
  static targets = ["pingForm", "latency"]
  ...
  measureLatency() {
    ...
    this.displayLatency()
  }
  ...
  displayLatency() {
    this.latencyTarget.textContent = this.latency + " ms"
  }
}
Et voilà, there you have it! Our homemade Hotwire ping tool!
Discussion
Now that you know how to make a ping tool with Hotwire, you can go further by adding a feature to pause and resume the ping process, for example. You can also try to improve the measurement in all modern browsers, as it seems to work better with Chrome than other browsers (especially Firefox).
See you next time with more Hotwire magic!


Oldest comments (0)