The Story
In the previous article titled How To Configure Jaeger Data Source On Grafana And Debug Network Issues With Bind-utilities. I described how to configure Jaeger on Grafana but I did not go into the details on how we can use Jaeger tracing on an application.
If you did not read the previous article, please do so now before we go down the rabbit hole.
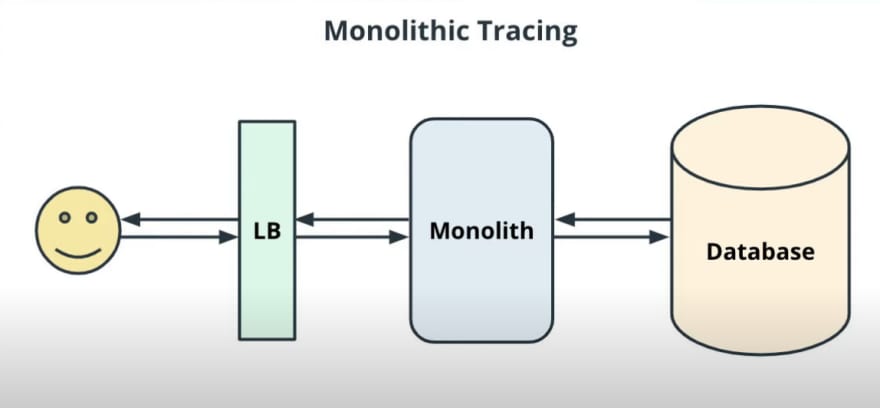
To understand better let's quickly visit our not so distant past, most applications are a built-in single-contained monolithic system where the application would execute in order of operations down a pretty clear path as shown in the image below.
First, the user would send a request which would be received by a load balancer, and then route it to the monolithic application and finally the database. As we want to know the request latency, we would want to trace it on the way back. The monolith has all the application services bundled into one block this is a good example of monolithic tracing.
Now if we consider distributed tracing where we use microservices and in which they are all decoupled, the transaction path will be very different. The transaction occurs across several distributed services, this is illustrated in the image below.
Similarly, the user would send a request which would be received by a load balancer. But in this case, we don't have a monolithic application.
We have a whole set of microservices. The question is now,
how do we trace through these distributed services?
Well, distributed tracing allows us to follow the request as it goes
through the various services to the database and of course, the trip back.
From the image, you may notice that not every service was hit because, for that specific request, it probably didn't need those other two services.
This is a very common scenario, and we can use distributed tracing to trace the request through the various services therefore we're able to trace these very separate microservices and still get relevant latency information.
For this post, we will use the Jaeger service which is a distributed tracing service. It is a distributed tracing service that is used to trace distributed transactions that collect data when a request is initiated. This process triggers the creation of a special trace ID and the initial span (parent span).
Datadog details how distributed tracing works perfectly:
End-to-end distributed tracing platforms start collecting data as soon as a request is initiated, such as when a user fills out a form on a website. This causes the tracing platform to generate a unique trace ID and an initial span, known as the parent span. A trace represents the entire execution path of the request, with each span representing a single unit of work along the way, such as an API call or database query. A top-level child span is created whenever a request enters a service. If the request contained multiple commands or queries within the same service, the top-level child span may act as a parent to child spans nested beneath it.
A hierarchical bar chart is frequently used to visualize traces. A distributed trace illustrates the dependencies and durations of distinct microservices processing the request, similar to how Gantt charts represent subtask dependencies and durations in a project.
This is illustrated in the image below.
To understand what spans and traces is let's look at the definitions as described by opentracing:
- Trace: The description of a transaction as it moves through a distributed system.
- Span: A named, timed operation representing a piece of the workflow. Spans accept key: value tags as well as fine-grained, timestamped, structured logs attached to the particular span instance.
- Span context: Trace information that accompanies the distributed transaction, including when it passes the service to service over the network or through a message bus. The span context contains the trace identifier, span identifier, and any other data that the tracing system needs to propagate to the downstream service.
Before we go deeper into the details of how to use Jaeger, read the Jaeger docs.
Back to the reason, I started this blog post. before I go deeper into the rabbit hole
This post will detail how to deploy a demo application called Hot R.O.D (Rides on Demand) that consists of several microservices and illustrates the use of the OpenTracing API.
It will be deployed in a k3s cluster with Jaeger backend to view the traces. Read more about the app here
If all that does not ring a bell, check out my previous post on How To Configure Jaeger Data Source On Grafana And Debug Network Issues With Bind-utilities.
TL;DR
Life's too short read the whole d*** article...
The How
Before you continue, ensure that you have the following:
- Kubernetes cluster with Jaeger backend installed
The Walk-through
First, we need to create a namespace for the Jaeger backend, a dedicated directory for the Kubernetes YAML manifests.
export namespace=observability
mkdir -p ./manifests/jaeger-tracing/
Then we need to create a hotrod Jaeger instance as hotrod-traces and update the hotrod-traces-query Jaeger-operator YAML manifest to change ports from the default configuration into nodePort, which will enable us to expose the Jaeger backend on a port 30686.
cat >> manifests/jaeger-tracing/jaeger-hotrod.yaml << EOF
apiVersion: jaegertracing.io/v1
kind: Jaeger
metadata:
  name: hotrod-traces
  namespace: {namespace}
---
apiVersion: v1
kind: Service
metadata:
  name: hotrod-traces-query
  namespace: {namespace}
spec:
  ports:
    - name: http-query
      port: 16686
      protocol: TCP
      targetPort: 16686
      nodePort: 30686
  selector:
    app: jaeger
    app.kubernetes.io/component: all-in-one
    app.kubernetes.io/instance: hotrod-traces
    app.kubernetes.io/managed-by: jaeger-operator
    app.kubernetes.io/name: hotrod-traces
    app.kubernetes.io/part-of: jaeger
  type: NodePort
EOF
We then apply the hotrod-traces-query service to the hotrod-traces Jaeger instance and confirm that the service is running, as shown below.
kubectl apply -n {namespace} -f manifests/jaeger-tracing/jaeger-hotrod.yaml
Now that we have a running Jaeger instance, we can create a hotrod-traces-query service and apply it to the hotrod-traces Jaeger instance.
Let's create a hotrod.yaml service and deployment manifest that will be used to deploy the Jaeger backend with the latest example-hotrod image from jaegertracing/jaeger.
cat >> manifests/jaeger-tracing/hotrod.yaml << EOF
apiVersion: v1
kind: Service
metadata:
  name: hotrod
  labels:
    app: hotrod
spec:
  ports:
    - port: 8080
  selector:
    app: hotrod
    tier: frontend
  type: LoadBalancer
---
apiVersion: apps/v1
kind: Deployment
metadata:
  annotations:
    sidecar.jaegertracing.io/inject: "true"
  labels:
    name: hotrod
  name: hotrod
spec:
  selector:
    matchLabels:
      app: hotrod
      tier: frontend
  template:
    metadata:
      labels:
        app: hotrod
        tier: frontend
    spec:
      containers:
        - image: jaegertracing/example-hotrod:latest
          args: ["all"]
          name: hotrod
          imagePullPolicy: Always
          ports:
            - containerPort: 8080
              protocol: TCP
          env:
            - name: JAEGER_AGENT_HOST
              value: hotrod-traces-agent.{namespace}.svc.cluster.local
            - name: JAEGER_AGENT_PORT
              value: "6831"
EOF
After creating the hotrod.yaml manifest, we can deploy the Jaeger backend and confirm that the service is running as shown below.
kubectl apply -n {namespace} -f manifests/jaeger-tracing/hotrod.yaml
Assuming that everything is running as expected, we can access the Hot R.O.D application but since we used Kubernetes LB and did not configure a static port we will use it to access our application.
We will need to find the port that the service is running on from the hotrod service using the command below.
Note: This port will be randomly assigned by Kubernetes.
kubectl get svc -n {namespace} hotrod -o json | jq '.spec.ports[0].nodePort'
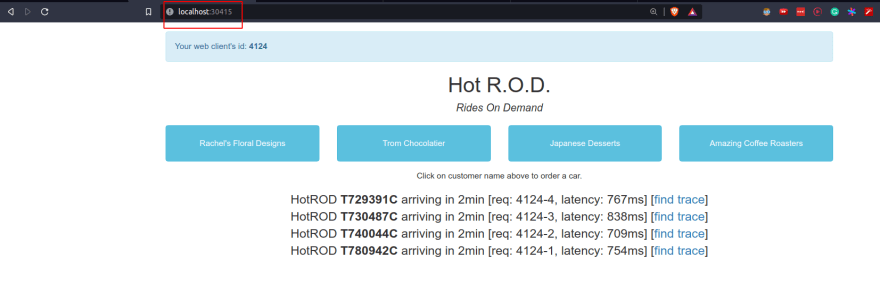
Once we have the port, we can access http://localhost:30415 from the browser before issuing requests which would trigger Jaeger to record the traces.
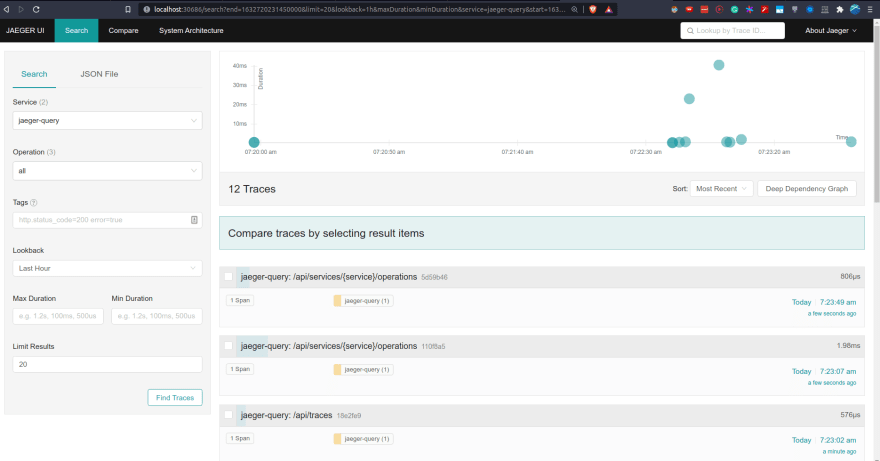
On the second tab, we can open http://localhost:30686 to see the traces that were recorded by Jaeger on the UI.
In the Jaeger UI, you can see the traces that were recorded by Jaeger.
- Under "Service", choose any of the services shown in the drop-down menu then select "Find Traces"
- In the results, click and examine the spans.
The images below show various services and their spans.
If you want to understand more about the data in the images above, I recommend you to read this article titled Take OpenTracing for a HotROD ride as this is beyond the scope of this post.
Conclusion
In this blog post, we covered a few topics related to Jaeger and how distributed tracing differ from monolithic tracing. How one can set up a simple distributed tracing system in Kubernetes and deploy a simple microservices application before using Jaeger tracing to understand how long requests take to complete thereby improving the application performance.


Top comments (0)