Deploy the OpenTelemetry Astronomy Shop sample app and use innovative features in New Relic to resolve problems.
Whether you’re just getting started with OpenTelemetry, or you’re a seasoned expert, you might be wondering about support for this increasingly popular technology in New Relic. In this blog post, you’ll learn how our built-in OpenTelemetry in-context experience—constructed on top of traces, metrics, and logs—helps you diagnose issues faster. And addressing problems sooner gives you the confidence to run your services with high uptime, performance, and reliability, so you can focus on innovation.
Examples and the tutorial in this blog post use the OpenTelemetry Astronomy Shop Demo to show what you can do with OpenTelemetry and New Relic. This application is built and maintained by the OpenTelemetry open-source community, and it provides a real-world example of a distributed application that’s been instrumented with OpenTelemetry. In the Deploying the OpenTelemetry Astronomy Shop demo app section, you’ll have an opportunity to get hands-on experience spinning up your own version of this application. You’ll learn how to:
Deploy an application instrumented with OpenTelemetry and export telemetry data via the OpenTelemetry Protocol (OTLP) to New Relic.
Install New Relic Prometheus integrations to gather data from the Kafka, PostgreSQL, and Redis components used by the demo application.
Install the New Relic Kubernetes integration to give you visibility into the Kubernetes cluster used to host the demo application.
Use Terraform to configure workloads, service level objectives (SLOs), and alert policies in New Relic.
Let’s start by considering ways you can leverage New Relic and OpenTelemetry capabilities with the services you manage.
Getting OpenTelemetry data into New Relic
OpenTelemetry is an open source project (opentelemetry.io) and unified standard for service instrumentation that provides an application programming interface (API), libraries, integrations, and a software development kit (SDK) for programming languages including Java, Go, and Python.
It includes a centralized collector service that you can use for collecting telemetry data from your applications and services, along with exporters to send that data to an observability platform, such as New Relic.
After an application is instrumented with OpenTelemetry, export the generated telemetry data to New Relic. New Relic provides native support for the OpenTelemetry Protocol (OTLP), which means you can ingest your metrics, traces, and log signals into our highly scalable and secure platform in a vendor-neutral way.
This approach differentiates New Relic from several other observability vendors that require deploying proprietary components as part of the OTLP pipeline.
Using OpenTelemetry with New Relic
It’s important to remember that the OpenTelemetry agent, by itself, isn’t an observability solution. To get the most value out of your OpenTelemetry data, a platform is required to surface actionable insights from the signals generated by your instrumentation.
New Relic is a telemetry-agnostic platform where you can get actionable insights, leveraging built-in features and capabilities such as alert correlation, topology discovery, service level management, and more.
In the next sections, you’ll learn how you can use these five powerful New Relic capabilities to troubleshoot issues with your OpenTelemetry-instrumented applications:
- workloads
- errors inbox
- service summary
- change tracking
- service levels
Workloads
With workloads in New Relic, you can group related entities for aggregated health and activity data from frontend to backend services across your entire stack. Workloads help you understand the status of complex systems, detect issues, understand the cause and impact of an incident, and resolve those issues quickly.
The demo application includes two workloads:
OpenTelemetry Demo - All Entities includes all of the entities related to the demo application.
OpenTelemetry Demo - Services includes just the OpenTelemetry services.
The OpenTelemetry Demo - All Entities workload shows you the health of OpenTelemetry services, hosts, and Kubernetes entities such as containers and pods, so you can quickly see which entities are unhealthy and require investigation:

Workloads are defined using tags, which makes them dynamic. For example, the OpenTelemetry Demo - All Entitiesworkload includes all entities associated with the Kubernetes cluster named otel-community-demo. Any entities that are added to this Kuberenetes cluster in the future will be included in this workload automatically.
The dependency map for a workload helps to understand the complexity of the system and makes troubleshooting efforts faster. In this example, New Relic automatically creates a map of the microservices application and infrastructure for hosts, Kubernetes entities such as containers, and application services dependencies:
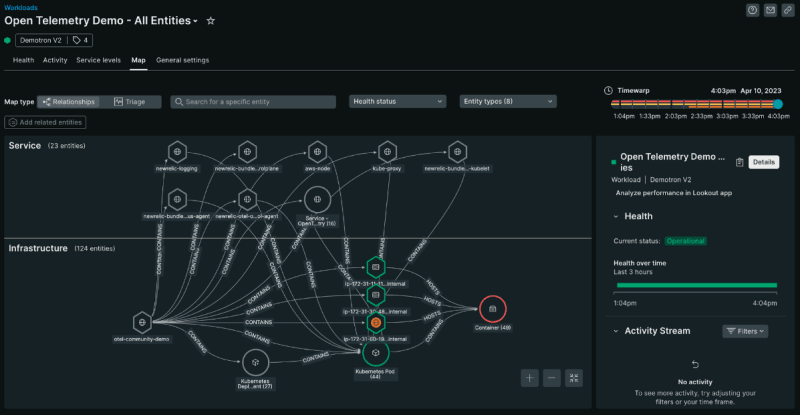
We recommend creating workloads to group OpenTelemetry services together with related entities. This could include infrastructure, APM, Kubernetes, browser monitoring, and other types of entities.
Workloads are particularly valuable for large environments with thousands of entities because you can use them to group entities into more manageable chunks, typically aligned with the teams responsible for those entities.
Errors inbox
Creating workloads unlocks other valuable capabilities in New Relic, such as errors inbox, where your teams can proactively detect, triage, and take action on errors before they affect your customers, the users of your application.
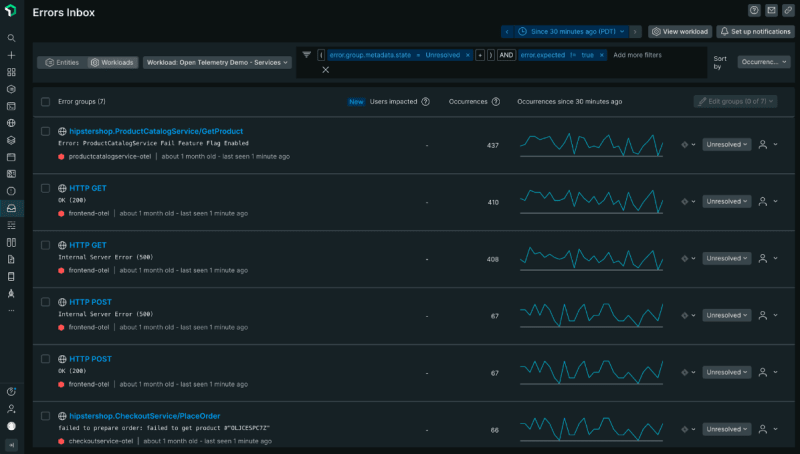
Errors are grouped intelligently to cut down on noise and ensure that critical errors are detected quickly and efficiently. Then your team can resolve errors from across your stack with visibility to all APM, browser monitoring (real user monitoring, or RUM), mobile monitoring, serverless (AWS Lambda), and OpenTelemetry errors in one place.
Select Errors Inbox and then OpenTelemetry Demo-Services under Workloads, and you'll see several errors occurring in the sample application:
Now troubleshoot one of the errors that’s happening with the AdService. Select an error to display the error group summary, where you can see several related log messages:

This demonstrates logs-in-context, which lets you see your log data in the context of other data in other parts of the New Relic platform.
In this case, the log messages are displayed in the context of errors that were captured with OpenTelemetry traces.
You’ll see that this log event includes trace.id and span.id attributes. The presence of these attributes allows you to correlate this log event with a specific trace:

You can also look at the distributed trace, to see how this error impacted various services in our application. In the entity map, you can see that the error originated at the AdService, and then bubbled up to the Frontend component:

Drilling down into the error further, you can see that a stack trace has been captured, which shows the exact line of code where this error occurred:

We recommend using errors inbox to proactively review and remediate the most frequently occurring errors before they impact your users. And by the way, all data in New Relic is queryable with NRQL, New Relic query language. This includes the span data that make up distributed traces you just looked at, metric and log data, errors, and even deployment markers.
In this section, you saw examples of how to get to the root cause of the error within a few clicks, starting from errors inbox.
Service summary
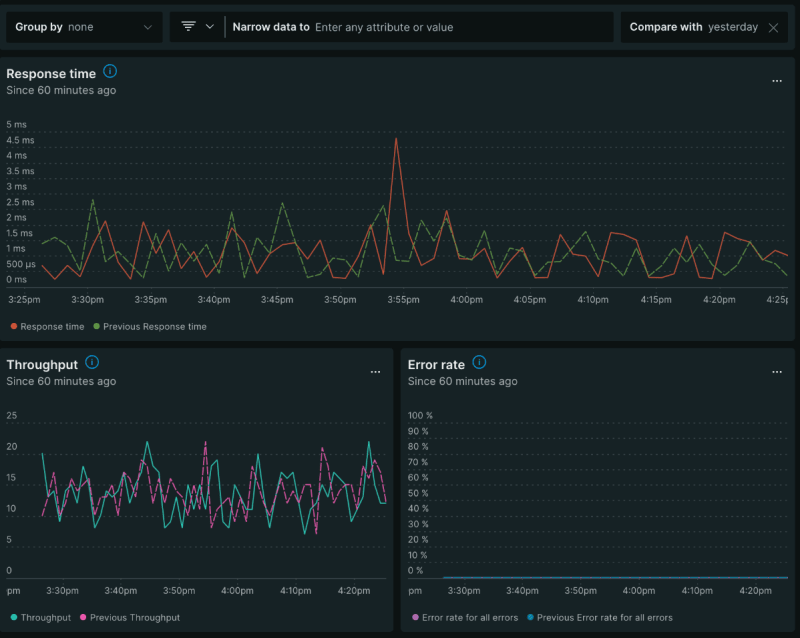
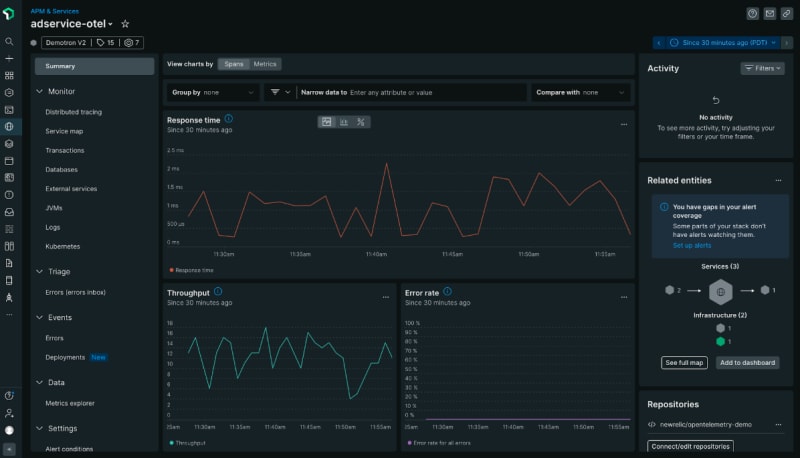
The service summary view provides an overview of the response time, throughput, and error rate for a particular service, along with a view of other service and infrastructure dependencies.
With the response time chart, you can select group by to facet the data by a particular attribute, such as the response type of the adservice:

Notice at the top of the page, you can toggle the data type to choose whether you want spans or metrics to drive the charts.
When using spans to drive the charts, keep in mind that spans could be sampled, and sampling could mean that certain measurements, throughput in particular, may be inaccurate.
While metrics are not subject to the effects of sampling, depending on the language, they might not be reported by all OpenTelemetry-instrumented services.
You can also add filters to further refine the view. Select Compare with to compare current performance with yesterday or last week.
You also can view the response time as a histogram, or use the percentile view:
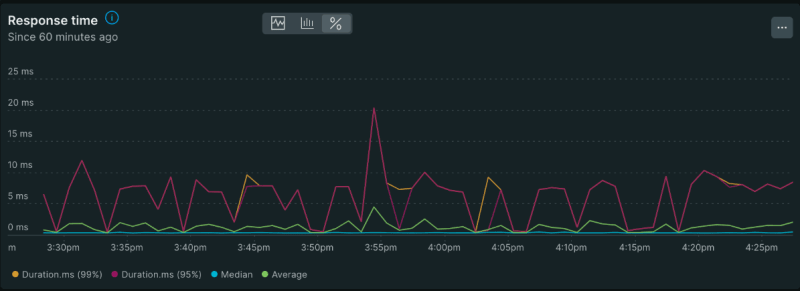
And by the way, on any of these charts you can view the underlying NRQL query. You can also create an alert condition directly from the chart, add it to a dashboard, or copy a permalink to share it with others. Select the three dots in the upper corner of the chart and select View query.
Change tracking
Being able to track development changes that occur across your systems is a fundamental practice in your observability journey. To help you, use change tracking for reporting deployment events into New Relic via an API, which you can incorporate into your CI/CD pipeline.
Get details and insights about each of the changes you track, such as faceted errors, log attribute trends, related issues and anomalies, and calculated impacts on key signals:

With these insights, you'll be able to quickly understand the impact of changes on system performance and quality. Change tracking metadata, such as commit secure hash algorithms (SHAs), changelogs, and deep links, will help you resolve issues more quickly.
You can also see a history of deployment events for this particular service, and how the golden signals have changed over time.
Service levels
You use service levels to measure the performance of a service from the point of view of your end users (or client applications). With New Relic, you can define and consume service level indicators (SLIs) and service level objectives (SLOs) for your applications. We recommend configuring service levels for OpenTelemetry-instrumented services.
The demo application includes two service levels:
- AdService Service Level
- CartService Service Level
You can view these service levels in New Relic by selecting the Service Level tab of the OpenTelemetry Demo - All Entities workload. Later when you deploy the demo app you'll use this view to track the SLI attainment over time (%), and see the compliance for each service level. In the demo application, you can see that the AdService is not consistently meeting its service level objective:

You can also monitor the error budget for each SLO, which indicates what percentage of requests could still have a bad response over the SLO period, without compromising the objective:

Deploying the OpenTelemetry Astronomy Shop demo app
You’ve learned how you can use innovative features and capabilities in New Relic to troubleshoot issues with OpenTelemetry-instrumented applications. Now you’re ready to deploy the OpenTelemetry Astronomy Shop Demo application in your own environment, so you can see New Relic and OpenTelemetry in action for yourself.
There are 4 main steps:
Deploy an application instrumented with OpenTelemetry and export OTLP data to New Relic.
Install New Relic Prometheus integrations to gather data from the Kafka, PostgreSQL, and Redis components used by the demo application.
Install the New Relic Kubernetes integration to give you visibility into the Kubernetes cluster used to host the demo application.
Use Terraform to automate the configuration of workloads, service level objectives, and alert policies in New Relic.
Prerequisites
If you’d like to follow along and install the demo in your own environment, you’ll need:
A pre-existing Kubernetes 1.23+ Cluster (You can spin up a local cluster using minikube or kind.)
Helm 3.9+ (See the Helm installation instructions.)
A New Relic account (If you don't already have one, sign up for a free account.)
4 GB of free RAM to run the application
The steps in the next sections assume that kubectl is already connected to the Kubernetes cluster where you’ll be installing the application.
The OpenTelemetry community demo
You’ll be using the OpenTelemetry Astronomy Shop Demo for this tutorial. This application is built and maintained by the OpenTelemetry open-source community, and it provides a real-world example of a distributed application that’s been instrumented with OpenTelemetry.
The demo application is composed of microservices that are written in multiple languages (including Java, Go, Python, Ruby, C#, and many others). It includes a load generator based on Locust to generate user traffic. The services communicate with each other using either HTTP or gRPC. See the OpenTelemetry demo architecture for more details.
Services are instrumented with OpenTelemetry using a mix of auto and manual instrumentation. For example, the Ad Service, which is Java-based, relies on the OpenTelemetry Java Agent to automatically instrument libraries. It then uses the OpenTelemetry SDK to add attributes to auto-instrumented spans, add span events, capture custom metrics, and more.
Step 1: Deploy the demo app
To deploy the application instrumented with OpenTelemetry and export OTLP data to New Relic, you’ll clone the Git repo, and install the Helm chart. Then you’ll view the OpenTelemetry data in New Relic to make sure everything is working.
1. Clone the Git repo
New Relic created a fork of the OpenTelemetry demo application, which builds on the community demo app by adding:
A values.yaml template to customize the deployment for New Relic.
Customized documentation that walks you through the installation process.
The first step is navigate to the directory where you’d like to install the demo in your local environment and clone the repository:
git clone https://github.com/newrelic/opentelemetry-demo.git
Then navigate to that directory:
cd opentelemetry-demo
2. Install the Helm chart
In this tutorial, you’ll use a Helm chart to install the application on your Kubernetes cluster. There are a few steps to installing and configuring the Helm chart.
- To install the Helm chart, you first need to add the OpenTelemetry Helm chart repository:
helm repo add open-telemetry https://open-telemetry.github.io/opentelemetry-helm-charts
Find your New Relic license key. A license key is required to export OpenTelemetry data to New Relic. You can find yours by navigating to the API Keys page in the New Relic account where you’d like to send the data for this application. Ensure the key you’ve chosen has an INGEST - LICENSE type.
Create a Kubernetes secret. Rather than hard code our New Relic license key in a configuration file, create a Kubernetes secret to store its value instead:
kubectl create secret generic newrelic-key-secret --from-literal=new_relic_license_key='<NEW_RELIC_LICENSE_KEY>'
- Change the Kubernetes cluster name. The
values.yamlfile in the helm folder assumes that the name of the Kubernetes cluster where the application will be deployed is namedotel-community-demo. If your Kubernetes cluster has a different name, such asminikube, update thevalues.yamlfile with the appropriate name:
processors:
      batch:
        send_batch_size: 1000
        send_batch_max_size: 1000
      cumulativetodelta: {}
      resource:
        attributes:
          - key: host.id
            from_attribute: host.name
            action: upsert
          - key: k8s.cluster.name
            value: otel-community-demo
            action: insert
Install the OpenTelemetry demo chart. To install the Helm chart with the release name newrelic-otel, run the next command and pass in the provided values.yaml file to customize the deployment:
helm upgrade --install newrelic-otel open-telemetry/opentelemetry-demo --values ./helm/values.yaml
Note: If your New Relic account is in Europe, install the chart using this endpoint instead:
helm upgrade --install newrelic-otel open-telemetry/opentelemetry-demo --values ./helm/values.yaml --set opentelemetry-collector.config.exporters.otlp.endpoint="otlp.eu01.nr-data.net:4317"
It will take a few minutes to download images and run the application.
3. View OpenTelemetry data in New Relic
You’ve cloned the repo for the sample app and installed the Helm chart. Before you proceed with additional configuration steps, take a moment to ensure the OpenTelemetry data is flowing successfully to New Relic.
In New Relic, go to APM & Services. Under Services - OpenTelemetry, select the service named adservice-otel. A summary page shows the golden signals for the service, which should look something like this:
Congratulations, you’ve successfully deployed an application instrumented with OpenTelemetry and exported that data to New Relic!
If you’d like to access the Astronomy Shop application itself, run the this command in your terminal:
kubectl port-forward svc/newrelic-otel-frontendproxy 8080:8080
Then you can access the application by going to http://localhost:8080/.
Step 2: Install Prometheus integrations
Now you have the ability to monitor golden signals and traces in the Astronomy Shop demo application, but you still have gaps in your observability because you don't have any insight into how Kafka, PostgreSQL, and Redis are performing. Let's fix that now by installing New Relic Prometheus integrations to gather data from those components in the demo app.
- Add the Prometheus Helm repository First, add the Prometheus Helm chart repository:
helm repo add prometheus-community https://prometheus-community.github.io/helm-charts
- Install the Prometheus exporters Prometheus exporters are used to export metrics from third-party systems as Prometheus metrics. You can install Prometheus exporters for Kafka, PostgreSQL, and Redis using the these Helm commands:
helm upgrade --install prometheus-kafka-exporter prometheus-community/prometheus-kafka-exporter --values ./helm/prometheus-kafka-exporter/values.yaml
helm upgrade --install prometheus-postgres-exporter prometheus-community/prometheus-postgres-exporter --values ./helm/prometheus-postgres-exporter/values.yaml
helm upgrade --install prometheus-redis-exporter prometheus-community/prometheus-redis-exporter --values ./helm/prometheus-redis-exporter/values.yaml
The Prometheus data won’t be available in New Relic just yet. You need to install the Kubernetes infrastructure integration first, which is covered in the next section.
Step 3: Install the Kubernetes infrastructure integration
Now install the New Relic Kubernetes integration to provide visibility into the Kubernetes cluster that hosts the demo application.
1. Create a namespace
Create a namespace in the Kubernetes cluster named newrelic:
kubectl create namespace newrelic
2. Add the New Relic Helm repository
Add the New Relic Helm repository with this command:
helm repo add newrelic https://helm-charts.newrelic.com
3. Install the Kubernetes integration
Now you’re ready to Install the New Relic Kubernetes integration. Be sure to replace <NEW_RELIC_LICENSE_KEY> with your New Relic ingest license key and <K8S_CLUSTER_NAME> with the Kubernetes cluster name before running this command in your environment:
helm upgrade --install newrelic-bundle newrelic/nri-bundle \
 --set global.licenseKey=<NEW_RELIC_LICENSE_KEY> \
 --set global.cluster=<K8S_CLUSTER_NAME> \
 --namespace=newrelic \
 --set newrelic-infrastructure.privileged=true \
 --set nri-metadata-injection.enable=true \
 --set kube-state-metrics.enabled=true \
 --set newrelic-logging.enabled=false \
 --set nri-kube-events.enabled=true \
 --set newrelic-prometheus-agent.enabled=true \
 --set newrelic-prometheus-agent.lowDataMode=true
Note: Unless you customized the values.yaml file when installing the demo application earlier, the Kubernetes cluster name will be otel-community-demo.
4. View the Kubernetes instrumentation in New Relic
Now confirm that the Kubernetes integration was installed successfully.
In New Relic, select All Capabilities and then select Kubernetes. You’ll see a list of Kubernetes clusters. Select the one named otel-community-demo.
At this point you should see the New Relic Kubernetes cluster explorer, which uses the data collected by the Kubernetes integration to show the status of your cluster, from the control plane to nodes and pods:

5. View OpenTelemetry metrics in New Relic
Now confirm that you’re seeing Prometheus data successfully in New Relic.
Select Query Your Data and run this query in New Relic Query Language (NRQL):
FROM Metric SELECT count(*) WHERE app_kubernetes_io_instance='prometheus-redis-exporter' FACET metricName
The query should return a list of ten metrics associated with the Prometheus Redis exporter, along with the count:

Step 4: Automate New Relic configuration with Terraform
Your final installation step is to automate the configuration of New Relic features and capabilities that you learned about at the beginning of this blog post:
- workloads
- service levels
- alert policies
You could configure these manually in the New Relic UI, but here you’ll learn how to use the New Relic Terraform Provider to automate creating these entities instead.
1. Install Terraform
First, install Terraform using these Terraform instructions.
2. Configure the provider
Configure environment variables by adding this code to ~/.bash_profile (if using Bash shell) or ~/.zshrc (if using Z shell):
export NEW_RELIC_API_KEY="<your New Relic User API key>"
export NEW_RELIC_REGION="US"
Note: Be sure to update the commands above with your User API key and region (if necessary)
3. Initialize your terraform setup
Navigate to the newrelic-config folder and then run this command:
cd newrelic-config
terraform init
4. Apply the configuration
Still within the newrelic-config folder, run this command to create the workloads, service levels, and alert policies in your account:
terraform apply -var="account_id=<YOUR ACCOUNT ID>" -var="cluster_name=otel-community-demo"
Substitute cluster_name with the name of the Kubernetes (K8s) cluster and <YOUR ACCOUNT ID> with the New Relic account ID where your demo is running.
5. Validate the configuration
Ready to confirm that the service levels have been created successfully in New Relic? Select the Service levels tab of the OpenTelemetry Demo - All Entities workload. It should look something like the this screenshot (although it will take some time to determine whether SLO compliance has been achieved):

To read this full New Relic blog, click here.

Top comments (0)