TL;DR
In this guide, we will explored how to leverage XUnit and OpenTelemetry to instrument .NET test projects. The process of setting up the XUnit.Otel.Template demonstrates the ease with which developers can start instrumenting their tests, making it accessible even for those new to OpenTelemetry or Aspire Dashboard.
Source code : https://github.com/NikiforovAll/xunit-instrumentation-otel-template

Table of Contents:
Introduction
As discussed in my previous blog post - Automated Tests Instrumentation via OpenTelemetry and Aspire Dashboard, we can utilize OpenTelemetry and Aspire Dashboard to gain valuable insights into the execution of our tests. This allows us to collect and analyze data over time, enabling us to identify potential anomalies.
Considering the positive response from the community, I have taken the initiative to enhance the existing approach and create a reusable starter template for everyone to benefit from.
Installation
❯ dotnet new install XUnit.Otel.Template::1.0.0
# The following template packages will be installed:
# XUnit.Otel.Template::1.0.0
# Success: XUnit.Otel.Template::1.0.0 installed the following templates:
# Template Name Short Name Language Tags
# ------------- ---------- -------- -------------------------
# XUnit Otel xunit-otel [C#] XUnit/Tests/OpenTelemetry
Generate:
❯ dotnet new xunit-otel -o $dev/XUnitOtelExample01 -n XUnitOtelExample
# The template "XUnit Otel" was created successfully.
Run Tests
Now let’s navigate to the project directory and run test project with additional option (environment variable really) to include warmup trace. Warmup trace is a special trace that shows how much time it takes to configure dependencies:
❯ XUNIT_OTEL_TRACE_WARMUP=true dotnet test
# Restore complete (1.2s)
# You are using a preview version of .NET. See: https://aka.ms/dotnet-support-policy
# XUnitOtelExample succeeded (4.9s) → bin\Debug\net8.0\XUnitOtelExample.dll
# XUnitOtelExample test succeeded (2.8s)

# Build succeeded in 9.2s
# Test run succeeded. Total: 3 Failed: 0 Passed: 3 Skipped: 0, Duration: 2.8s
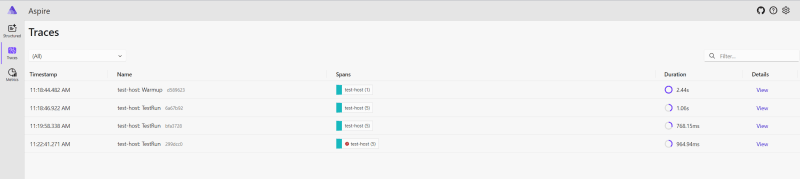
Let’s navigate to http://localhost:18888/traces to see the results of test execution.
☝️ Aspire Dashboard is automatically started based on Testcontainers setup as part of BaseFixture.

As you can see, there are two traces one for test run and one for warmup.
Explore the code
Before we move further let’s explore the content of exemplary test suit.
[TracePerTestRun]
public class ExampleTests(BaseFixture fixture) : BaseContext(fixture)
{
    [Fact]
    public async Task WaitRandomTime_Success()
    {
        // ...
    }

    [Fact]
    public async Task WaitRandomTime_ProducesSubActivity_Success()
    {
        // ...
    }

    [Fact]
    public async Task WaitRandomTime_AsyncWait_Success()
    {
       // ...
    }
}
WaitRandomTime_Success : This test waits for a random duration between 100 and 500 milliseconds and then asserts that the operation completes successfully. Note, the special method called Runner. It is intended to wrap the asserted code so we can capture exceptions and enrich the traces with additional data such as exception message, trace, etc.
[Fact]
public async Task WaitRandomTime_Success()
{
    // Given
    int waitFor = Random.Shared.Next(100, 500);
    TimeSpan delay = TimeSpan.FromMilliseconds(waitFor);

    // When
    await Task.Delay(delay);

    // Then
    Runner(() => Assert.True(true));
}
WaitRandomTime_ProducesSubActivity_Success : Similar to the first, but it waits for a shorter random duration (between 50 and 250 milliseconds). It also starts a new activity named “SubActivity”, logs an event indicating a delay has been waited for, and sets a tag with the delay duration. The test asserts success after the wait. This example demonstrate how to add additional traces to test suit if needed.
[Fact]
public async Task WaitRandomTime_ProducesSubActivity_Success()
{
    // Given
    using var myActivity = BaseFixture.ActivitySource.StartActivity("SubActivity");
    int waitFor = Random.Shared.Next(50, 250);
    TimeSpan delay = TimeSpan.FromMilliseconds(waitFor);

    // When
    await Task.Delay(delay);
    myActivity?.AddEvent(new($"WaitedForDelay"));
    myActivity?.SetTag("subA_activity:delay", waitFor);

    // Then
    Runner(() => Assert.True(true));
}
WaitRandomTime_AsyncWait_Success : This test is partially shown. Like the others, it waits for a random duration between 50 and 250 milliseconds then within a Runner method, waits for the delay again before asserting a condition that is always true. This demonstrates asynchronous Runner execution.
[Fact]
public async Task WaitRandomTime_AsyncWait_Success()
{
    // Given
    int waitFor = Random.Shared.Next(50, 250);
    TimeSpan delay = TimeSpan.FromMilliseconds(waitFor);

    // When
    await Task.Delay(delay);

    // Then

    await Runner(async () =>
    {
        await Task.Delay(delay);

        Assert.True(true);
    });
}
Results of Test Run
Here is the result of trace output, as you can see, every test has it’s own trace and we can see how tests are executed sequentially by XUnit:

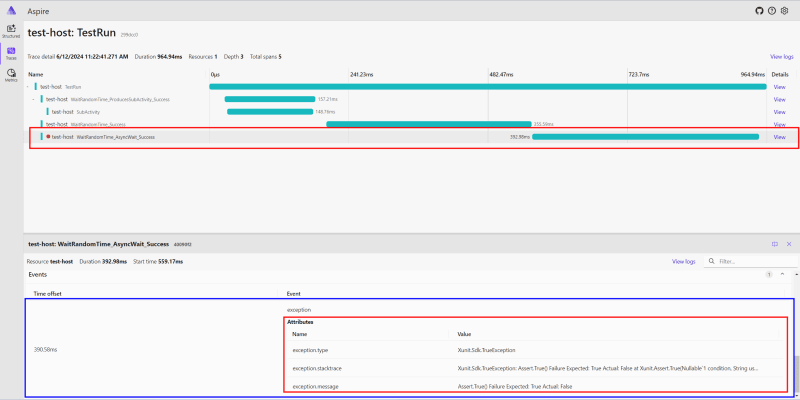
Now, let’s modify the WaitRandomTime_AsyncWait_Success test to intentionally cause it to fail. This will allow us to observe how the test framework displays failed tests:
Below are the details of the test run. Failed tests are readily identifiable on the Aspire Dashboard, where each failed test is accompanied by an Trace Event with exception details. This event provides detailed insights into the reasons behind the test failure.
Metrics
These metrics highlight the execution time on a per-test and per-class basis, categorized by tags.
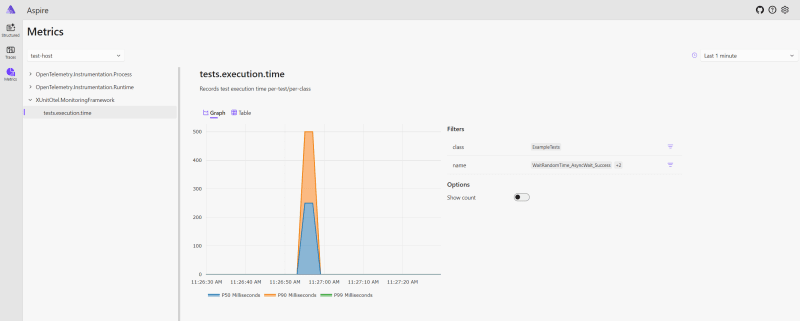
The P50 percentile, also known as the median, represents the middle value of a dataset when it’s sorted in ascending order. In the context of test execution, the P50 percentile for execution time tells you that:
- 50% of your tests complete faster than this time.
- 50% of your tests complete slower than this time.
Here’s how you can use the P50 percentile for test execution:
1. Performance Benchmark:
- The P50 provides a good representation of the “typical” test execution time.
- You can use it as a baseline to compare performance over time. For example, if your P50 increases significantly after a code change, it might indicate a performance regression.
2. Setting Realistic Expectations:
- Instead of focusing on the absolute fastest or slowest tests, the P50 gives you a realistic idea of how long most tests take to execute.
3. Identifying Areas for Improvement:
- While the P50 represents the median, a large difference between the P50 and higher percentiles (like P90 or P95) indicates a wide spread in execution times.
- This suggests that some tests are significantly slower than others, and you might want to investigate those outliers for potential optimizations.
Example:
Let’s say your test suite has a P50 execution time of 200 milliseconds. This means:
- Half of your tests finish in under 200 milliseconds.
- Half of your tests take longer than 200 milliseconds.
In summary, the P50 percentile provides a valuable metric for understanding the typical performance of your tests and identifying areas for optimization. It helps you set realistic expectations, track performance trends, and make informed decisions about your testing process.
Conclusion
In this guide, we’ve explored how to leverage XUnit and OpenTelemetry to instrument our .NET test projects, providing a deeper insight into our test executions with the Aspire Dashboard. By integrating these tools, developers can gain valuable metrics and traces that illuminate the performance and behavior of tests in a way that traditional testing frameworks cannot match.
The process of setting up the XUnit.Otel.Template demonstrates the ease with which developers can start instrumenting their tests, making it accessible even for those new to OpenTelemetry or Aspire Dashboard. The examples provided show not only how to implement basic test instrumentation but also how to enrich our tests with additional data, such as custom activities and events, to gain more detailed insights.
The ability to visualize test executions and metrics on the Aspire Dashboard transforms the way we perceive and interact with our test suites. It allows us to quickly identify and address failures, understand performance bottlenecks, and improve the reliability and efficiency of our tests over time.
As we continue to evolve our testing strategies, the integration of OpenTelemetry and Aspire Dashboard with XUnit represents a significant step forward in achieving more observable, reliable, and insightful test suites. This guide serves as a starting point for developers looking to enhance their testing practices with these powerful tools.

Top comments (0)