At OneSignal, we love Rust. We have blogged before about pivoting some of our core business systems to Rust, how the language has changed over the past several years, and interesting things we’ve learned about the thread safety model. Other than Onepush, the core of our push notification delivery system, we also use Rust for a gRPC service and multiple Kafka consumers. In this article, we’re going to talk about a stumbling block that we ran into with one of our newest Rust projects.
The Challenge
Near the end of February, we announced the general availability of our Journeys feature. Journeys allows customers to easily build complex messaging workflows with a no-code UI. It is powered by a few gRPC services and a Kafka consumer written in Rust, called JourneyX. Journeys is an event-driven system, so everything that happens within a journey workflow is triggered by an event on a Kafka stream. These events are consumed by JourneyX (journey executor).
A few weeks ago, as Journeys adoption started to increase and JourneyX started to process more events, we began to notice a disturbing pattern in its memory usage. The most active processes were consistently utilizing lots of memory, then getting killed by the kernel. The Linux kernel has a piece of functionality called the OOM (out-of-memory) killer, which will automatically kill processes when they consume too much of the system memory. This prevents the system from becoming unstable or locking up due to resource starvation. In our case, the JourneyX processes were constantly being killed, restarted, and killed again by the OOM killer. This showed up on a graph as a sawtooth pattern of rapid allocation and near-instant deallocation when the process was killed. Memory usage would spike up to 17 GiB in the busiest processes, but we expect one of these worker processes to need under 1 GiB.

Graph of memory usage for a single JourneyX process over 24 hours
This caused a few issues for us. Obviously from a theoretical perspective, we didn’t want a system that was constantly being killed by the OS. The operations it performed were idempotent, so we weren’t necessarily worried about sending multiple notifications due to this problem. The issue did create alert spam for us, which led us to over-provision on memory. The constant crashing also caused concern about the long-term health of the service.
BUT WAIT! I hear you say — doesn’t Rust’s borrow checker prevent memory errors? Isn’t Rust supposed to be “safe?” It turns out that, according to Rust’s rules, leaking memory is completely safe! In fact, we can purposely leak as much memory as we want using the function std::mem::forget. The only thing “unsafe” about memory leaks is that they might eventually result in your program being killed by the kernel (as JourneyX does in this case). A program ending in a predictable way is also considered safe behavior. Rust’s safety guarantees exist to protect us from invalid memory access, not resource starvation.
Troubleshooting with Distributed Tracing
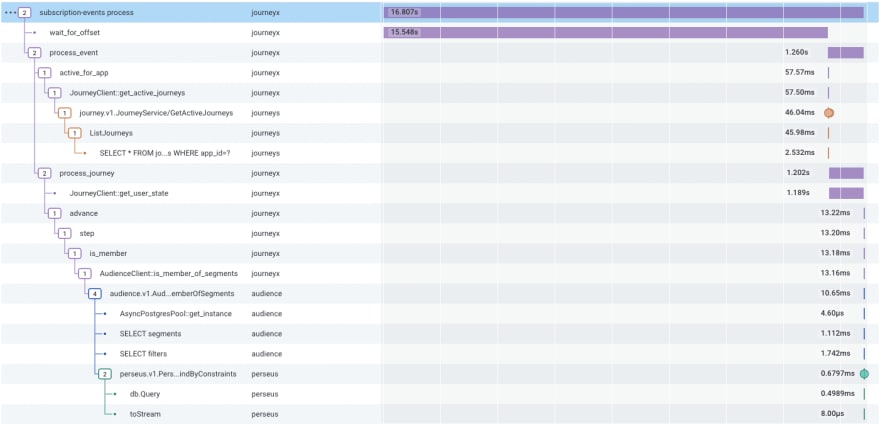
In addition to Rust, we’re big fans of distributed tracing. If you’re not familiar with tracing concepts, check out this document from Honeycomb's Introduction to Distributed Tracing. All of our services report trace data and send W3C trace propagation headers to one another so that we can tie operations together through our system. Tracing data in Honeycomb is now our first stop when our on-call team gets paged. Here is an example trace from our Journeys processing system.
In some languages, tracing instrumentation can be accomplished largely through automated means. In our Ruby on Rails codebase, the Honeycomb and OpenTelemetry libraries use ActiveSupport hooks to add trace spans around operations like HTTP handlers and ActiveRecord queries. Rust is a lot of things, but it's not really “runtime configurable.” There are libraries that allow you to write Rust code that can be configured at runtime, but most Rust code is not written in this way. Because of this, we need to add a lot of manual instrumentation to our Rust apps. We need to manually delineate operations into spans and add fields on those spans.
We have a few choices for adding these data to our codebases. We could use the Rust opentelemetry library, which is generic and standardized according to the OpenTelemetry specification. Instead, we use the tracing library, which is a façade crate, similar to log. It allows us to connect and configure multiple tracing backends, and it captures data from the log crate straight out of the box.
If we had some Rust code like this:
fn http_handler() {
    let data = get_data();
    let result = perform_expensive_computation(data);
}
And you wanted to put a span around the perform_expensive_computation function, you could do so like this:
use tracing::info_span;

fn http_handler() {
    let data = get_data();
    let span = info_span!(?data, "perform_expensive_computation");
    let _guard = span.enter();
    let result = perform_expensive_computation(data);
}
The enter function returns a guard that marks the time in which the span is active. It begins when you first call enter, and ends when the guard value is dropped as it goes out of scope. Rust’s Drop trait allows it to easily provide the functionality to run at the time it’s deallocated.
Within JourneyX, surrounding the “send a notification” HTTP request, we had the following snippet:
let (res, body) = {
    let query_span = tracing::info_span!("send HTTP request");
    let _guard = query_span.enter();
    self.client.request(body).await?.into_parts()
};
Now experienced users of the tracing library may already know the issue, but to those of us who aren’t intimately familiar with the API, this looks quite reasonable based on what I’ve already told you. If we look at the documentation for the enter method though, we may notice something that calls this into question.
Warning : in asynchronous code that uses async/await syntax, Span::enter should be used very carefully or avoided entirely. Holding the drop guard returned by Span::enter across .await points will result in incorrect traces.
Notice the last line of the block above uses .await when calling the request method. This is going to cause a problem for us. To see why, we need to look at the conceptual models for tracing and async Rust.
The .enter method from tracing returns what is conventionally referred to as a “guard” type. One of the great benefits of Rust’s ownership and lifetime system is that it provides the ability to write destructors for any type and to be sure about when those destructors are going to run. We can do this by implementing the Drop trait for any type. The interface looks (very, very roughly) like this:
struct EnterGuard {
}

impl Span {
  fn enter(&self) -> EnterGuard {
    begin_span(self.id);
    EnterGuard { id: self.id }
  }
}

impl Drop for EnterSpan {
  fn drop(&mut self) {
    end_span();
  }
}
Because of Rust’s destructor rules, the EnterSpan type will call the end_span function whenever the variable it’s attached to goes out of scope. Here is an annotated example:
fn do_something() -> i32 {
  let x = {
    let span = Span::new();
    let _guard = span.enter(); // begin_span called
    do_expensive_computation()
  }; // end_span called by the Drop of `_guard`

  let span = Span::new();
  let _guard = span.enter(); // begin_span called
  more_compute(x)
} // end_span called by the Drop of `_guard`
This is great because it means that most of the time, we just don’t need to worry about remembering to mark a span as complete. It just works (tm). For synchronous code, that’s definitely the case, but it falls apart for async code. To see why that's the case, let’s look at the pseudocode for begin_span and end_span.
thread_local! {
  static ACTIVE_SPANS: RefCell<Vec<SpanId>> = RefCell::new(Vec::new());
}

fn begin_span(id: SpanId) {
  ACTIVE_SPANS.with(|s| s.borrow_mut().push(id));
}

fn end_span() {
  ACTIVE_SPANS.with(|s| s.borrow_mut().pop());
}
Now this is incredibly simplified (please don’t get mad at me, tracing maintainers) but the general idea is that each thread maintains a stack of span IDs that represents the hierarchy of spans currently active. This works great for synchronous code, when each OS thread can maintain this state independently. When we use async code, however, we have multiple tasks running concurrently on top of the same OS thread, sharing thread locals. And the Drop handler for our EnterGuard won’t be called when context switches happen. That means if we were to write code like this:
let mut tasks = futures::stream::FuturesUnordered::new();
for id in 0..5 {
  tasks.push(async move {
    let span = info_span!(id, "task");
    let _guard = span.enter();
    tokio::time::sleep(std::time::Duration::from_millis(100)).await;
  });
}
futures::future::join_all(tasks).await;
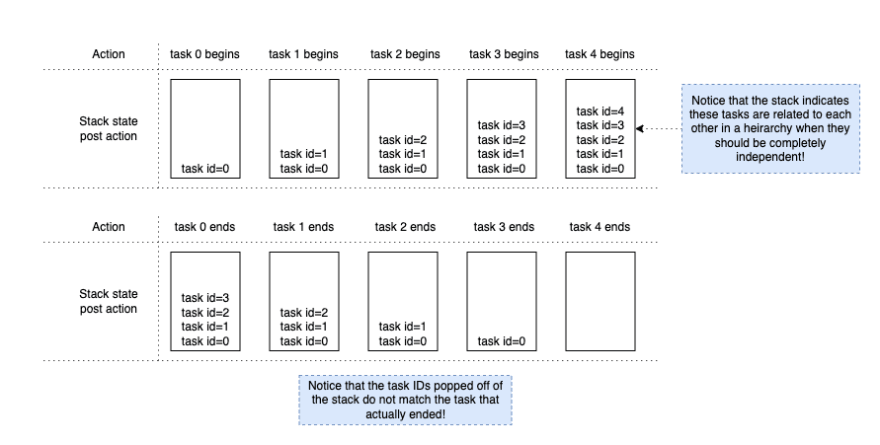
Let’s consider what happens to our thread-local stack at each stage in the task execution. For simplicity's sake, we’ll assume for now that these five tasks are executed in the order that they were enqueued, although this typically isn't the case.
Notice that at both the beginning and end of the spans there are large discrepancies in the state of the stack. When spans are beginning, we create a hierarchy on the stack that indicates all of the tasks have a parent/child relationship with one another, but this is not accurate. When spans end, we pop the wrong task span off of the stack, because the state of the stack is inconsistent with reality.
In our production code, this issue caused memory usage to skyrocket, because our span tree was essentially expanding endlessly and never able to shrink. Because of how quickly concurrent operations were occurring, the stack was continuously having new spans added to it, and previous spans (now with tens of thousands of children) would never be dropped.
The Solution
So what’s the fix? It’s very simple. Recall that the original code looked like this:
let (res, body) = {
    let query_span = tracing::info_span!("send HTTP request");
    let _guard = query_span.enter();
    self.client.request(body).await?.into_parts()
};
We need to update it to this:
let (res, body) = {
    let query_span = tracing::info_span!("send HTTP request");
    self.client.request(body).instrument(query_span).await?.into_parts()
};
It’s a subtle change, but absolutely critical. Let’s see how this works. This is once again simplified for the sake of brevity.
pub trait Instrument {
  fn instrument(self, span: Span) -> Instrumented<Self> {
    Instrumented { span, inner: self }
  }
}

pub struct Instrumented<T> {
  span: Span,
  inner: T,
}

impl<T> Future for Instrumented<T> where T: Future {
  type Output = T::Output;

  fn poll(self: Pin<&mut Self>, cx: &mut Context<'_>) -> Poll<Self::Output> {
      let _enter = self.span.enter();
      self.inner.poll(cx)
  }
}
There are a few things going on here. First off, we have the Instrument trait. This is an extension trait that exists only to allow us to build an Instrumented struct from an arbitrary Future. Instrumented is a wrapper future that allows us to have tight control over the polling logic. In this case, we use .enter to begin the span while the underlying future is polled, and end the span when the context switches.
This works because poll is the context-switching boundary of a future. While poll is being called, this future and its children are the only things burning CPU time on the thread. Other futures may be sleeping in the background, but nothing else can preempt the currently running future’s poll.
Tracing’s .enter method isn’t the only instance of this. There are many types that were not designed to be held across await points. Mutex, RwLock, and RefCell for example all have guard types that hold a lock on a resource and could result in deadlocks if held across await points.
So where do we go from here? There’s a subtle code difference that results in both incorrect observability results and potentially extreme memory usage. Normally, issues like this could be caught by the Rust compiler. There is an RFC to add a lint to the compiler called must_not_suspend which will allow developers to mark types as being unsafe to hold across await points. But there is still a lot of work remaining before this will land, so what should we do in the meantime?
Rust’s standard linting tool, Clippy, has existing lints for the Mutex and RefCell types, but we don’t want to have to create a custom Clippy lint for every type like this. A few weeks ago, I submitted rust-lang/clippy#8707 which allows Clippy users to provide a list of types that are not allowed to be held across await points. Once this makes it to Clippy’s stable release branch, users will be able to add the following to their clippy.toml files:
await-holding-invalid-types = [
  "tracing::trace::Entered",
  "tracing::trace::EnteredSpan",
]
This will provide users with a warning if a span’s enter guard is held across an await point when they run cargo Clippy. The warnings will look like this:
error: `tracing::trace::Entered` may not be held across an `await` point per `clippy.toml`
  --> main.rs:10:9
   |
LL | let _guard = span.enter();
   | ^^^^^^
This provides some amount of safeguarding, though the must_not_suspend lint will be a welcome improvement, as it will not require an explicit configuration in order to work.
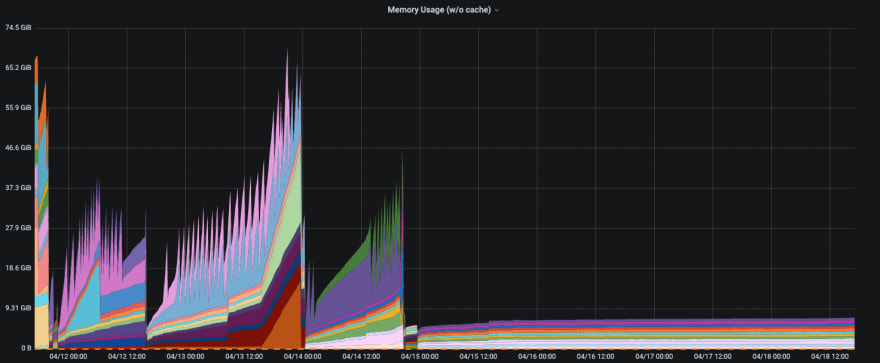
Thank you for coming with me on this journey of memory leak discovery! I’ll leave you with a four-day graph of the memory usage of our JourneyX processes. It’s quite clear when this change was deployed that we instantly fixed the issue with this very subtle code change.

A graph of the memory usage of our JourneyX processes over four days.
If you’re interested in working on using Rust in production to create high-throughput evented systems, distributed systems, or any other areas of engineering, please check out the OneSignal careers page!


Top comments (0)