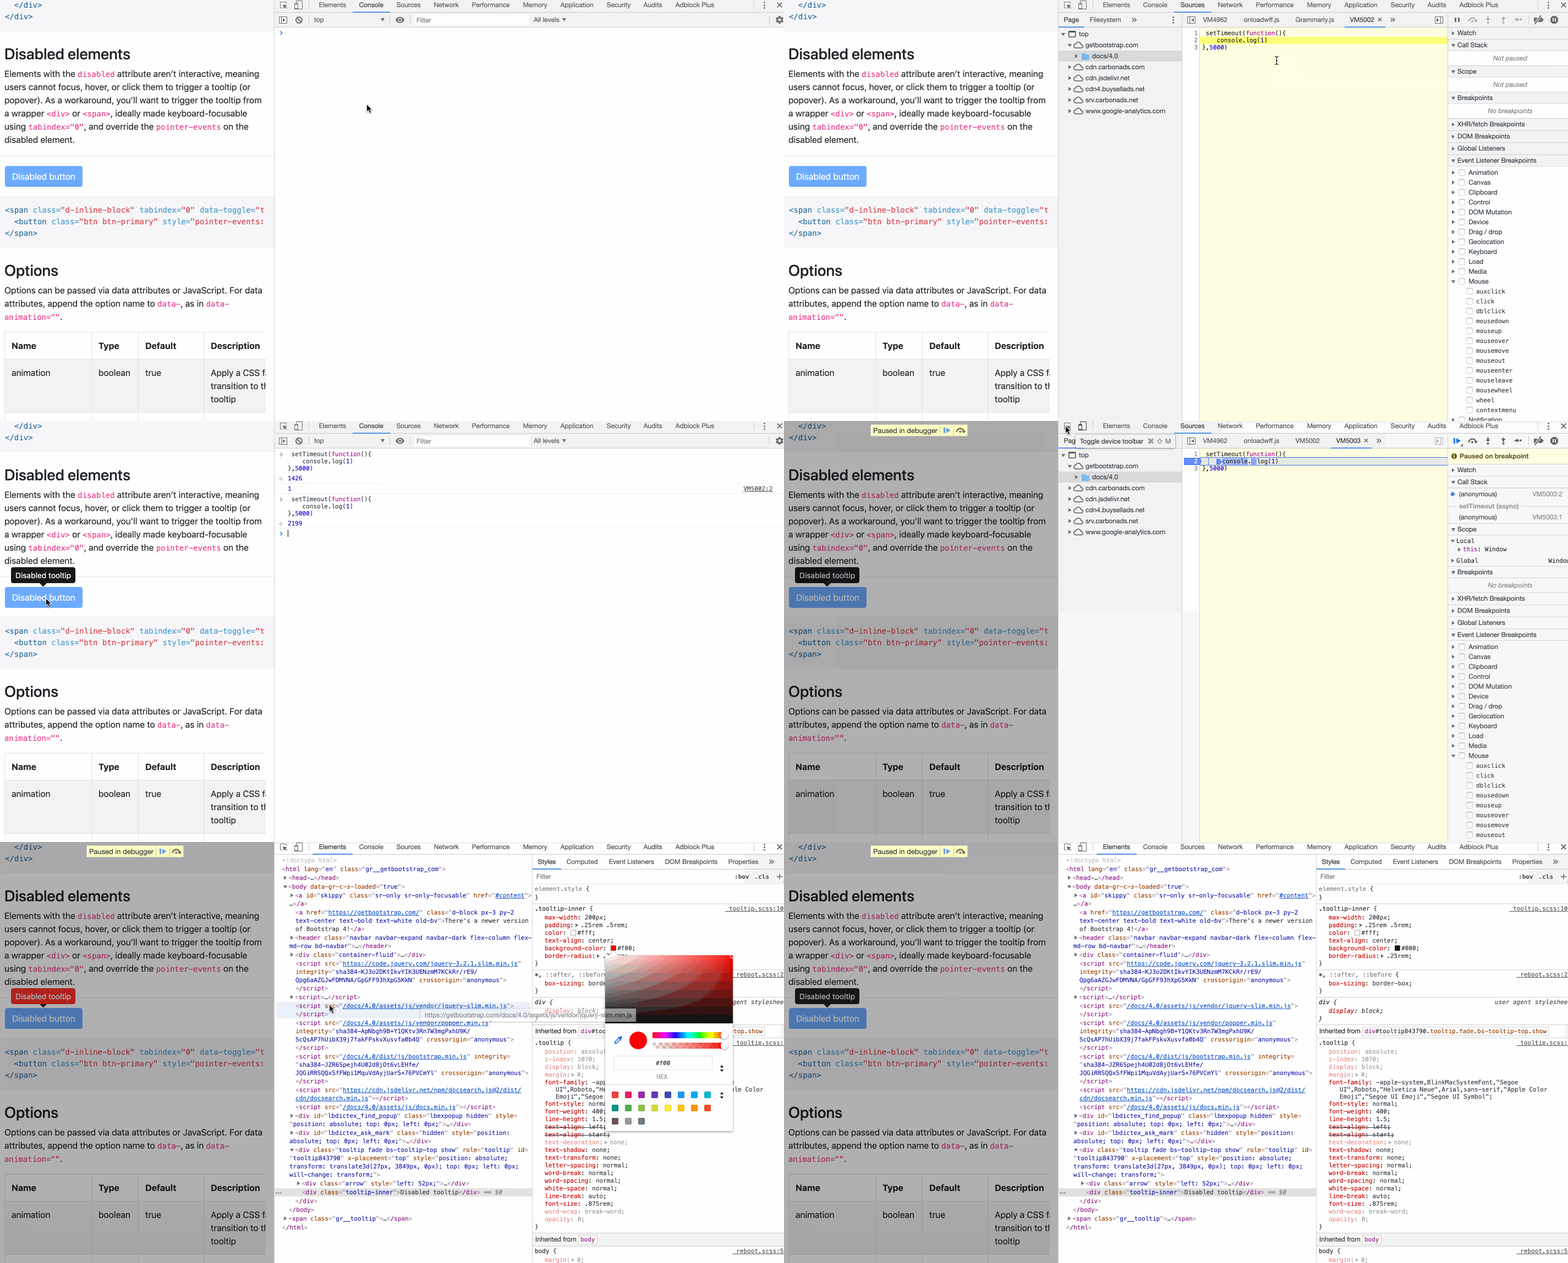
There are some cases when we suffering the web and see something with interesting style, amazing animation, you’re curious and want to know to how the web’s author implement that, especially if you’re a web designer. So the easiest way to answer that question is using inspect tool to inspect that element. But the problem is whenever we run inspect element tool, the style we want to inspect is disappear immediately regardless of how much effort. For example: tooltips, popups or something happen very quickly.
The example below show you how difficult to inspect tooltip content element that will disappear very quickly
To make our life become easier, in this blog I gonna show you 2 ways how to force the web stop immediately in order to use inspect element tool to inspect something only visible in a short period of time. Both of them base on the idea that we put a break point and force the website run into that breakpoint, by doing that we can force it stop their behavior and we can do everything wen want
The first way is using Event Listener Breakpoint
To use Event listener breakpoint, we just simple open chrome developer tool (by pressing F12), navigate to “Sources” tab, expand “Event Listener Breakpoints” and check “contextmenu” under “Mouse” event.
By doing this, we force the application jump right to the breakpoint whenever we trigger a right click event, stop their functionalities and let’s us do whatever we want while the application is in “sleep mode”. The reason we choose context menu rather than other events due to it’s rarely used, so we can make sure our breakpoint event can easily trigger and unique
But this way also have one drawback that it need one trigger to force stop the application which is not suitable in some case. SO to overcome that problem we need to find another way that can force application jump to breakpoint automatically, without require any more event trigger. This lead us to the second solution is setTimeout
We also can use setTimeout to make the breakpoint
Yes you don’t see wrong, setTimeout can be able to used to put the breakpoint. setTimeout is very handy in some cases it’s impossible to trigger another event to put the breakpoint due to website’s behavior. Let’s me show you how to do that
Firstly, open chrome developer tool, navigate to console tab and execute this line of code
setTimeout(()=>{
console.log("Stop");
},5000)
```
After executing that code, wait 5 more seconds to see a log message. when a log message is printed out, we click on the debugger at the rightsize to open the code that print the message. It will bring us to the source tab and show on the setTimeout code we have just executed. Put the breakpoint at line 2.
And now whenever we want to inspect something, just return that piece of code, make sure the element we want to inspect on the view, wait 5 seconds and the application will automatically run in sleep mode without require trigger any extra event

#Final word
Hope that 2 ways above I have just show you will be on your toolbox kit. When we want to inspect something in the view which only visible on the view in very short period of time or simply when we want to stop the application, at least we know more way to do that.


Top comments (7)
Execute below code on console and wait for the 7 sec, as tooltip showing may have delay
setTimeout(()=>{
debugger
},7000)
This is a very brilliant way, thanks
Finally found it. Thanks! I used mouseleave event listener for tooltip.
Finally!!! hahahaha I almost can't figure out how to do this damn thing! cheers
Hi, i need to inspect tooltip to find out which css to manipulate, but i'm not getting there. What ever i try i can't get the result as you're showing in the snapshots.
Is there any way you could explain to me a bit more in detail which steps i should take.
For a part its working but i can never catch the screen with the tooltip visible so i can inspect it.
Thanks,
Ron
Ps i'm on joomla 4 with bootstrap 5 and RSJoomla template.
Used Chrome and Firefox (normal and developper edition).
@phuchieu Event listener breakpoint section is not showing in the latest chrome browser
Hi, how to inspect Bootstrap5 Tooltip? The way with event listener breakpoints doesn't work.