In my previous post, I went over the basics of D3.js and explained how to build a simple bar chart with this tool. I also quickly introduced the event handling system to use interactivity on your chart. But while D3 is quite the comprehensive chart and data manipulation library, it falls short on a point that I think can be important with interactive visualisations: tooltips.
If you are unaware, tooltips are the small bubbles displayed next to your page's elements when you mouse over them. They are often used to provide additional information or guidance while keeping a clean interface.

So D3 doesn't provide resources for those yet. You could create your own very clever way of manipulating the DOM and inserting a new <div> floating around where you need it. For example, I have used Justin Palmer's solution for years, until it became outdated. Recently though, I have discovered Tippy.js and started using it in all of my D3 projects. Today I will show you how.
I will reuse my previous code as an example, so feel free to check out this post for more details. This code displays a simple bar chart, including update transitions and mouse over interactivity.

The Basic Idea
Our first task is to load Tippy and its dependency Popper (which deals with the tooltip placement) into our code. As recommended on Tippy's documentation, we will add it just before our own scripts:
<body>
    <h1>D3 Bar Chart Example</h1>
    <div id="barContainer"></div>

    <script src="https://unpkg.com/@popperjs/core@2"></script>
    <script src="https://unpkg.com/tippy.js@6"></script>

    <script type="text/javascript">
        // ...
    </script>
</body>
We will then create a function that will do the tooltip setup. You could easily just integrate it within our D3 update function (check the conclusion for a full code listing), this is purely to keep things clean for our example here:
// ...
function setTooltips(){

}
// ...
This function needs to accomplish two things:
- set the tooltip content based on the bar data; and
- tell tippy where our tooltips should originate from. For both steps, we need to grab our bar selection:
// ...
function setTooltips(){
    // select the bars
    bars = chart.selectAll('rect.bar');
}
// ...
To set the content of Tippy tooltips, you simply need to fill in the data-tippy-content attribute of your elements, which we can easily do and customise with each bar data using D3's .attr() method:
// ...
function setTooltips(){
    // select the bars
    bars = chart.selectAll('rect.bar');
    // set the tooltip content
    bars.attr('data-tippy-content', (d,i)=>{
        return `Key: ${d.key}, Value: ${d.value}`;
    });
}
// ...
Now each bar has an attribute that describes exactly what to put in the bar's tooltip. Here we simply want to see the element's key and value, for example: "Key: C, Value: 90"
For the next part, we will actually use Tippy to show and hide the tooltips when prompted (mouse over/out). For that, we simply need to call the function named ... tippy(). We just have to pass the DOM nodes that need to have a tooltip. The way to get these is by using D3's .nodes() function, which returns the DOM nodes associated with a selection:
// ...
function setTooltips(){
    // select the bars
    bars = chart.selectAll('rect.bar');
    // set the tooltip content
    bars.attr('data-tippy-content', (d,i)=>{
        return `Key: ${d.key}, Value: ${d.value}`;
    });
    // call tippy on the bars
    tippy(bars.nodes());
}
// ...
All that is left now is to actually call setTooltips() at the end of our update function:
// ...
function updateData(dataset){
    // ...
    setTooltips();
}
function setTooltips(){
    // ...
}
// ...
Et voilà:

Customising Tooltips
There are many ways you can customise your Tippy tooltips.
The first approach is to use CSS styles. Afterall, our tooltips are essentially div elements injected in the DOM, and can therefore be styled with your usual CSS:
.tippy-box{
    color: #fefefe;
    font-family: sans-serif;
    padding: 5px 8px;
    border-radius: 2px;
    opacity: 0.9;
    font-weight: bold;
}

The other approach is to use Tippy's props.
Props can be set in two ways. First, globally, for all the tooltips created with one tippy() call, by passing a props object as the second argument. Here, we just introduce some timing when showing and hiding tooltips:
// ...
function setTooltips(){
    bars = chart.selectAll('rect.bar');
    bars.attr('data-tippy-content', (d,i)=>{
        return `Key: ${d.key}, Value: ${d.value}`;
    })
    tippy(bars.nodes(),{
        delay: [400, 100],
        duration: [500, 200]
    })
}
// ...
The second way is to set props specifically on each element that will trigger a tooltip. In fact, we have already used this approach when setting the content of the tooltips. All you have to do is set an attribute data-tippy-<prop_name> on the elements. For example, we can set tooltip themes based on our data:
// ...
function setTooltips(){
    bars = chart.selectAll('rect.bar');
    bars.attr('data-tippy-content', (d,i)=>{
        return `Key: ${d.key}, Value: ${d.value}`;
    }).attr('data-tippy-theme', d=>{
        return d.value <= 30 ? 'red' : 'dark';
    })
    tippy(bars.nodes(),{
        delay: [400, 100],
        duration: [500, 200]
    })
}
// ...
Of course, this means we have to augment our styles a bit in the CSS:
.tippy-box{ /* ... */ }
.tippy-box[data-theme~='dark']{
    background-color: #222;
}
.tippy-box[data-theme~='red']{
    background-color: tomato;
}
/* styling the tooltip arrow */
.tippy-box[data-theme~='red'] > .tippy-arrow::before{
    /* make sure you match the border (top, bottom, ...)
       with the tooltip position */
    border-top-color: tomato;
}
For more details on styling tooltips with themes, check Tippy's documentation.
Now, we have tooltips turning red when the value of the bar is less than 30:

As you might have guessed, since we can set props globally and/or locally, it means you can also set a content prop for all tooltips if you wish: no need to set the same data-tippy-content repeatedly.
Removing Tooltips
One last thing about Tippy's tooltips. Because we called our setTooltips() function in our chart update process, removing bars that are no longer needed means that their attached tooltips are technically gone too.
But, there are a variety of reasons you might want to make sure these tooltips are gone forever even if only to avoid the classic animation/transition timing exceptions:

Fortunately, the tippy() actually returns instances of the tooltip objects created. What we can therefore do is:
- save those in a global list (i.e. not declared in our
setTooltips()scope); and - delete the previous tooltips whenever we want to draw new ones, using the
.destroy()method.
// ...
let barTooltips = [];
function updateData(dataset){
    // ...
    setTooltips();
}
function setTooltips(){
    barTooltips.forEach(t=>t.destroy());
    // ...
    barTooltips = tippy(bars.nodes(),{
        // ...
    })
}

Conclusion
Tippy takes care of all the positioning and life-cycle issues you would normally have to handle when dealing with tooltips. And it also provides us with a lot of customisable options: placement, style, timing, etc.
But what I find fascinating, is that, at its bare-minimum and even with a little bit of customisation, it is so simple to use and incorporate into your existing projects. Even the ones that already make a lot of DOM manipulation, like data visualisations with D3.

Top comments (2)
Thanks for this! It got me on the right track!
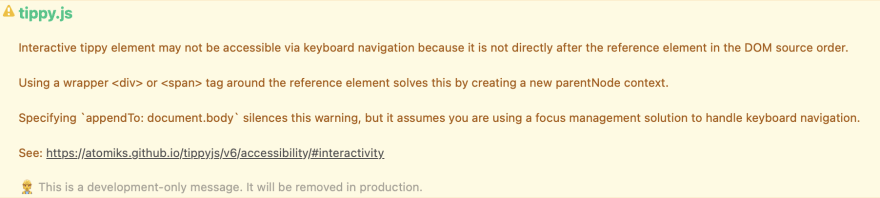
Do you have an idea how to handle this issue? I would like to create an interactive dialog around the d3 display based on which part I am hovering about but get this issue...
Looks neat! I'll definitely try this out :)