
In the last chapter of these series, we covered how to create your first Kibana dashboard for a sample web application.
Although that will help you setup Kibana for your production services, what you'll be doing 99% of the time would be to actually use the dashboard to monitor & debug issues you observe on production.
This is the final post in the series for monitoring Go applications \w Kibana. It will give you some practice using your newly created dashboard to identify problems with a sample web application.
So if you've setup Kibana for the first time or you've just joined your new team & seen your Kibana dashboards without a clue what's going on, this post is for you!
The Starting Point
First, make sure you have docker and docker-compose installed.
For docker, follow the installation instructions for your platform here.
For docker-compose, follow the installation instructions here.
Afterwards, download this exercise’s repository on the kibana-debugging-tutorial branch:
git clone --branch kibana-debugging-tutorial https://github.com/preslavmihaylov/tutorialsBoot up all docker containers:
docker-compose upRun this script to import the dashboard to Kibana from the project’s root:
./import-kibana-dashboard.shThis is the exact same dashboard as the one we create in this post.
Now, you should be good to go.
Verify everything is working properly by going to http://localhost:5601/app/kibana#, opening the Dashboard tab and making sure you see some incoming traffic with occasional errors:

Your Goal
In this tutorial, you have a black box application, which has the following HTTP API:
/payments/execute
/payments/list
/payments/authhold
In addition to these endpoints, what you'll see in the dashboard are some additional properties:
method - the HTTP method invoked
countryISO2 - the ISO2 of a user's country (e.g. US, FR, UK)
userID - the ID of the user making the request
paymentMethod - the payment method used for making a transaction
userType - the type of user (e.g. trial, individual, business)
Inspect the panels in the dashboard to see some sample data for these properties.
This API is the same as the one seen in the previous tutorials from the series.
The difference is that this time, the application fails under certain hardcoded conditions.
Example:
The application fails when the country is “US” and
the endpoint is “/payments/list” and the method is “PUT”
This is just an example, of course, it doesn’t necessarily mean that the application returns an error under these exact conditions (or does it?).
However, the failure conditions will be of that kind.
Your task is to use the Kibana dashboard you are given, apply some filters to narrow down the errors and figure out what are the exact conditions which cause an error.
There are 5 error conditions which you have to find out.
Here are the hints:
- The application fails when ________ and ________
- The application fails when ________ and ________
- The application fails when ________
- The application fails when ________ and ________ and ________ and ________
- The application fails when ________ and ________ and ________ and ________
The hints are ordered by the difficulty of finding the given error condition - The first condition is the easiest to find.
One caveat to have in mind is that you won’t be 100% sure that a given error condition you think you’ve found is correct.
Instead, focus on finding the first two error conditions first, write them down and then consult the walkthrough for the first two issues to verify if your assumptions are correct.
Then, continue with the third and final two error conditions and check the walkthrough for each of those steps again.
The Walkthrough
Before you go through this, I urge you to attempt the exercise on your own.
Use this only if you get stuck or if you want to check out some alternative ways to debug the issues.
Well, without further ado, let’s get started.
Finding Issue #1
Issue #1 is:
- The application fails when ________ and ________
First, go to your Errors table and filter the dashboard to only show the errors:

This will only filter the errors in the view, which will hide the irrelevant details we aren’t interested in.
After we do this, this is an example of what your dashboard should look like:

Notice the applied filter at the top-left. That’s the bar which shows all filters applied to the current dashboard. This is one of the main mechanisms you’ll use when debugging production issues.
Next, notice how the greatest amount of errors appears to happen on the /payments/authhold endpoint.
Apply that to the current filter as well:

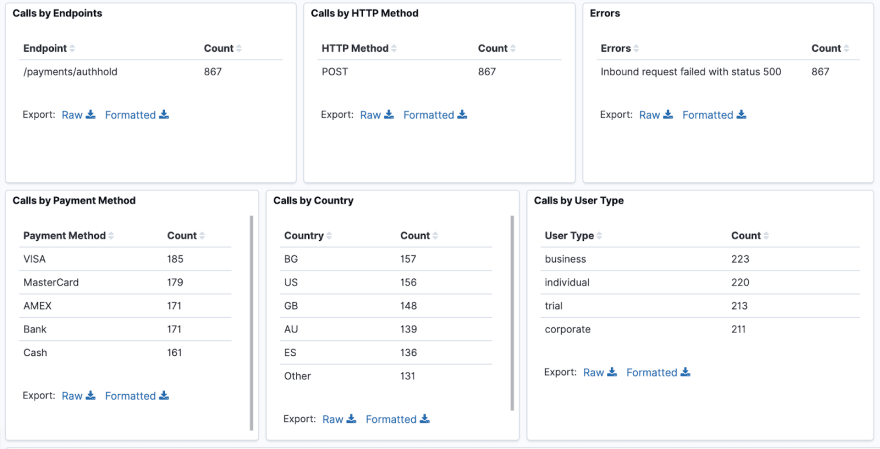
After we apply this filter, take a look at your tables:

It seems that the errors per value are evenly distributed across all tables except for the HTTP Method. There is an abnormal amount of errors which occur when the HTTP method is POST.
Apply a filter on the POST method and let’s see the results:
Notice that the rest of the errors per value remain evenly distributed.
This means that our first error condition is:
- The application fails when the endpoint is /payments/authhold and the HTTP method is POST
That’s a good start.
One important thing to do before you move on, however, is to exclude the current error conditions from the rest.
This will allow you to focus on the errors that are left, rather than rediscover the errors which you’ve already found.
It is enough to exclude one of the error conditions (as both of them have to match).
To do this, clear all current filters except for the error filter:
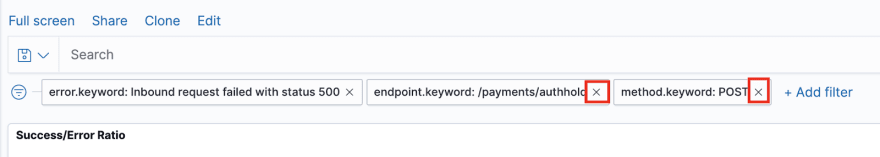
Next, exclude the endpoint /payments/authhold:

This is how your filters bar should look like:

Of course, it is possible (and is the case) that there are other error conditions that aren’t the one we found for the endpoint we excluded.
However, we will have to do some heuristics like this to narrow down the rest of the errors until there is no more room to “zoom in on”.
At that point, we will have to relax our filters a bit until something we are yet to discover pops up.
Typically, when working in a production environment, you would approach this kind of issue by finding a few problems at a time.
Only after you’ve fixed the most outstanding issues, will you narrow down on the rest of the issues in your application which aren’t so pervasive.
However, in this context, it would be quite shallow to only get a single error condition to discover. This is why you’ll have to discover all 5 at once.
But don’t worry, I’ve made sure the error conditions are quite distinct to one another in order to enable you to more easily discover them.
Let’s move on to the next issue.
Finding Issue #2
Issue #2 is:
- The application fails when ________ and ________
To find this one, we’ll take a very similar approach to the previous one. Take a good look at the errors distribution at a high level.
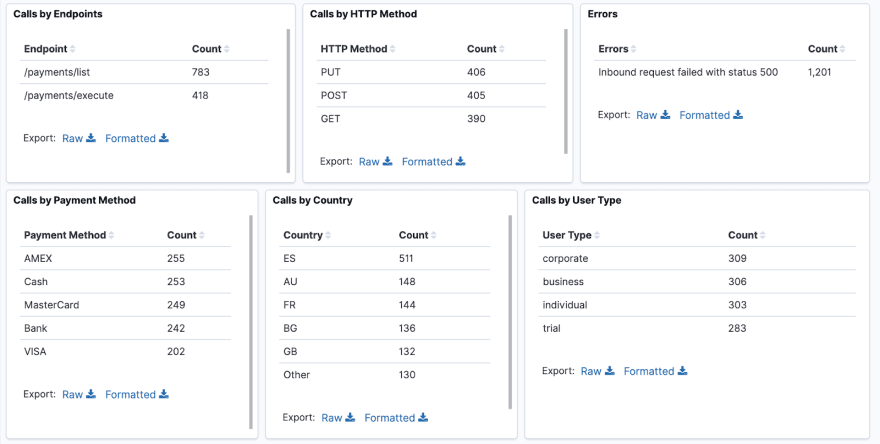
Notice the outstanding amount of errors for the /payments/list endpoint.
Filter by that value and take a look at the dashboard again:
As previously, there is one outstanding value which catches the eye. it is the ES country.
Filter by that value now:

As you see, it looks like all other values are evenly distributed when we filter by endpoint /payments/list and country ES.
This means, that the second error condition our application has is:
- The application fails when the endpoint is /payments/list and the country is ES
Nicely done. Now remove the filters we added in this step and exclude one of the error conditions we just discovered.
In this case, I would choose to exclude the ES country as excluding another endpoint will make the resulting view way too narrow.
This is what your filters bar should look like:
Let’s move on.
Finding Issue #3
Issue #3 is:
- The application fails when ________
Taking a look at the view we have now, there is nothing that immediately pops out:
So it's hard to narrow down in any direction from here.
However, there is one view on our dashboard which we’ve neglected thus far.
It is the detailed logs view at the bottom of the dashboard.
It will be the one which will guide us in the right direction:
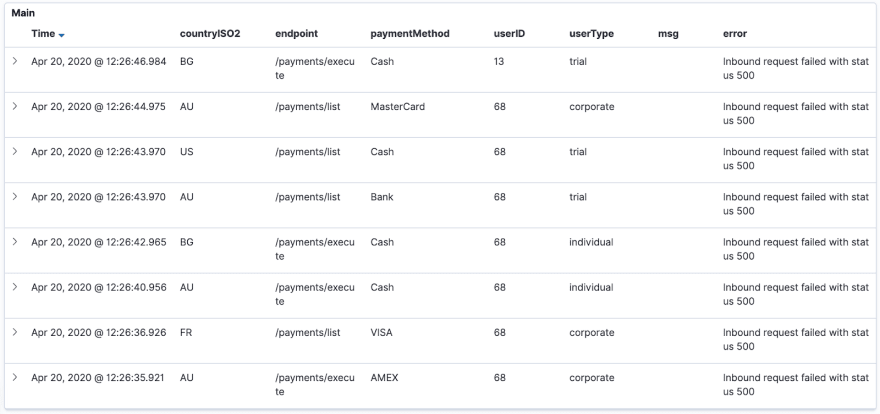
Do you notice something abnormal?
The amount of errors for user ID 68 tends to be quite high in comparison with other user IDs.
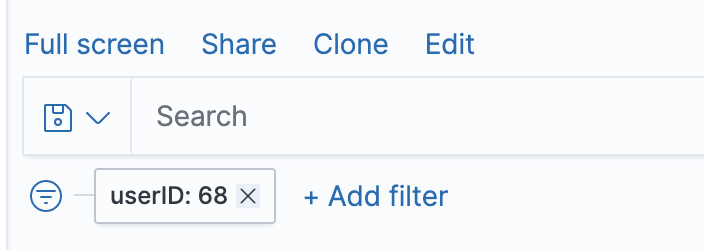
Perhaps there is something wrong with that user. Apply a filter on his user ID and see what the result is:
Notice that after we filter user ID 68, there is nothing extraordinary which pops out. Perhaps the application unconditionally fails for this user every time?
To test this hypothesis remove all filters except for the user ID. This is what the filters bar should look like:
After we do this, notice that there isn’t a single successful request for this user:
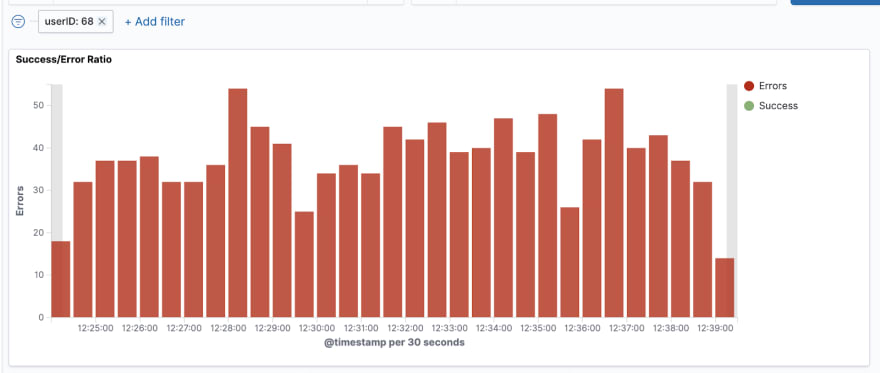
This is our third error condition:
- The application fails when the user ID is 68
Now that we’ve discovered this issue, there are still two more to go.
Finding them now will be significantly easier than at the beginning because we’re going to filter all other error conditions so that only those remaining will pop up.
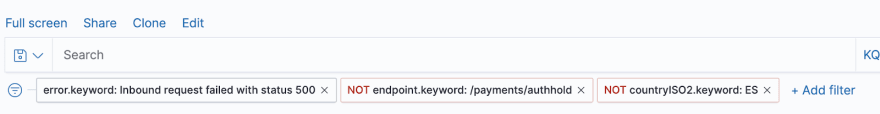
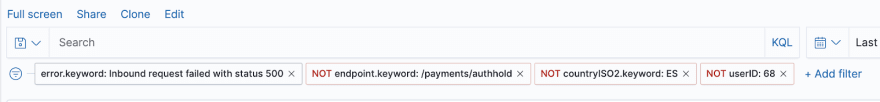
To do this, remove all filters and exclude the erroneous values from the previous issues along with the user ID we just found:
Finding Issues #4 and #5
Issues #4 and #5 are:
- The application fails when ________ and ________ and ________ and ________
- The application fails when ________ and ________ and ________ and ________
After applying all filters for the rest of the errors, you should have a very small number of errors remaining.
This is normal as these two errors are the hardest to hit due to the many input values which cause them.
Finding them first at the beginning is extremely difficult because of that.
However, now that we’ve narrowed down our errors so much, seeing the root cause for these issues is a lot easier.
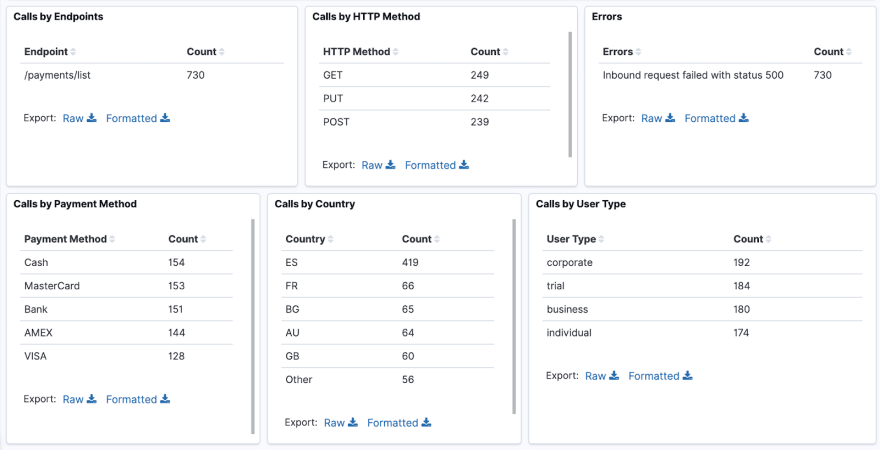
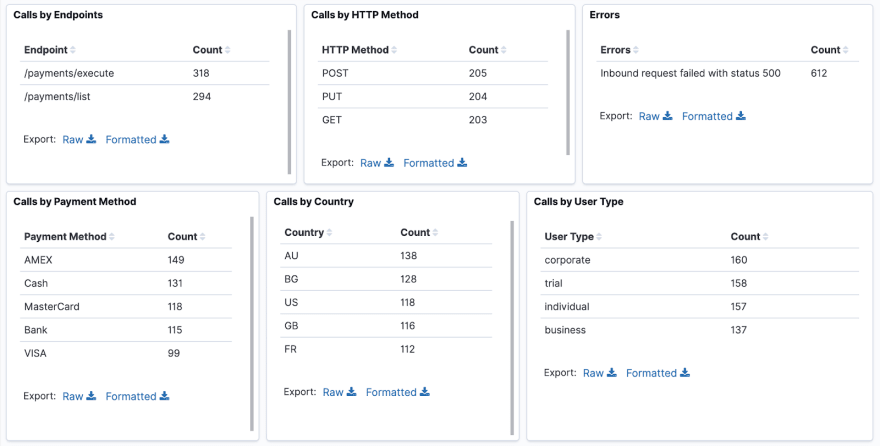
Take a look at the dashboard:

It seems that all errors are caused by the /payments/execute endpoint. This first part of the error condition is obvious and shared by both issues.
The rest of the values are not so obvious but they are all present in the current view.
We simply have to find out what combination of each value will match issue #4 and, respectively, issue #5.
At this point, we can simply guess until the solution pops out.
Let’s start by filtering the GET method.
The solution to any of the issues isn’t obvious yet:
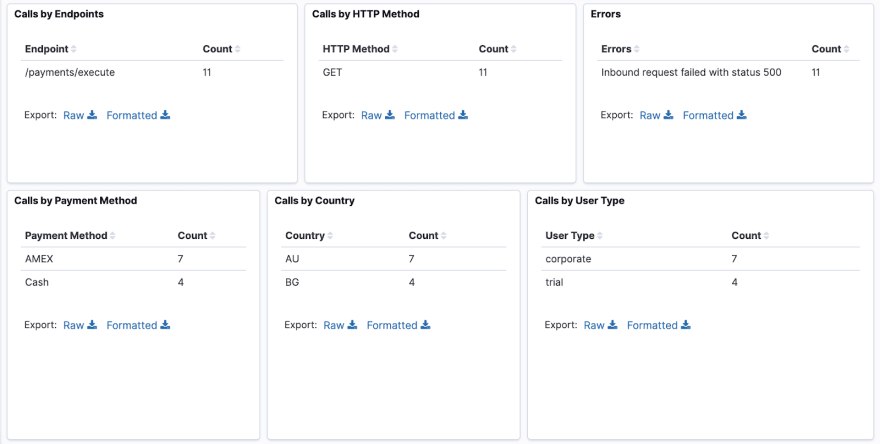
Let’s continue by filtering the AMEX payment method:

It appears we’ve found one of our issues.
However, there is one problem - it currently appears that the error condition consists of five different inputs, while both issues consist of four inputs.
Now, we have to find the odd one out.
We can do this by removing the filter on any of the parameters on-screen.
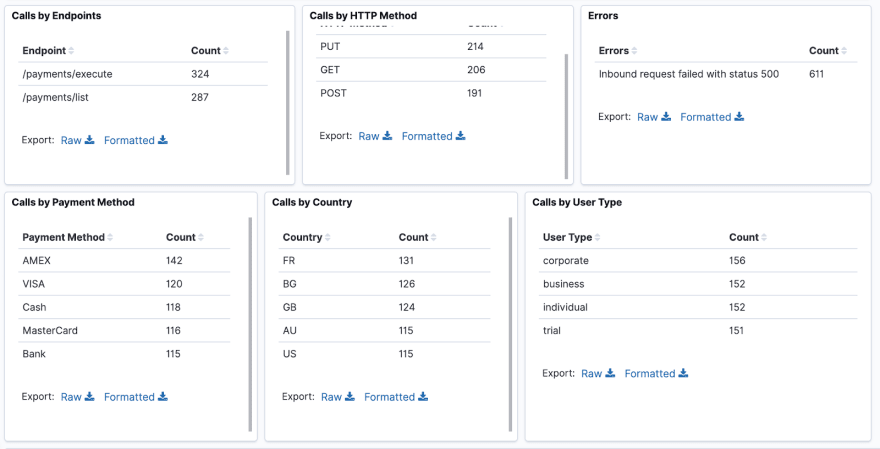
After several iterations of trial-and-error, you will figure out that when we remove the filter on the GET method, it can be seen that the error happens on other methods as well:
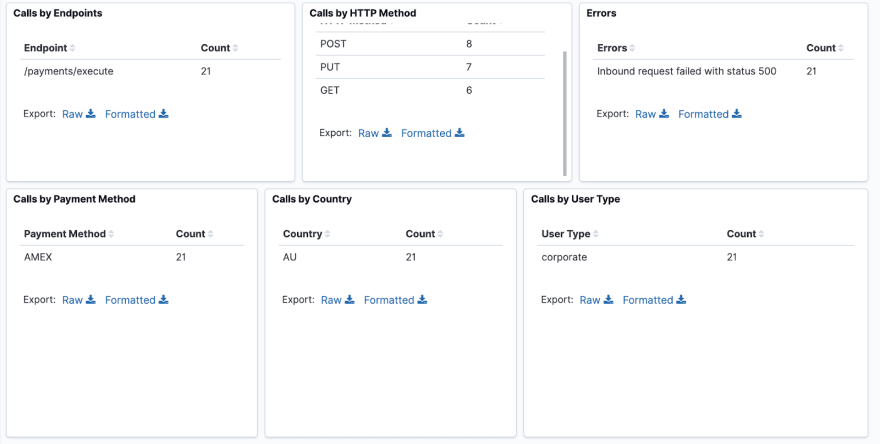
This leads us to the conclusion that issue #4 is:
- The application fails when the endpoint is /payments/execute and the payment method is AMEX and the country is AU and the user type is corporate
Now, exclude one of those parameters, e.g. the AMEX payment method and the final issue is evident:
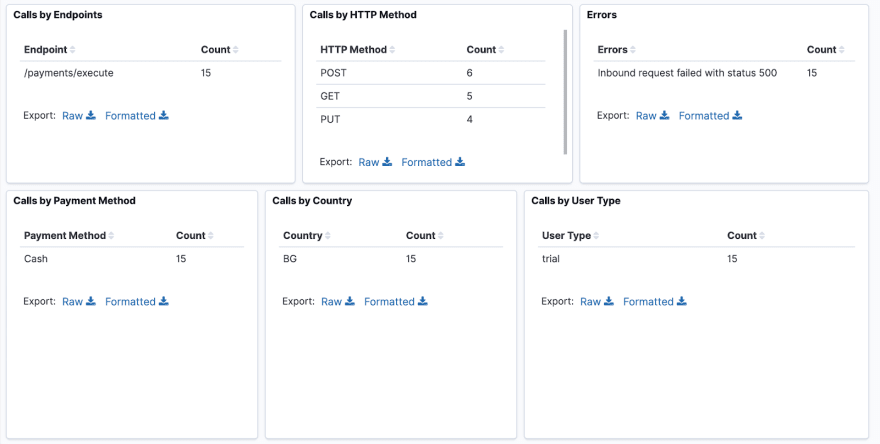
Issue #5 is:
- The application fails when the endpoint is /payments/execute and the payment method is Cash and the country is BG and the user type is trial
Conclusion
Congratulations. 👏👏👏
You’ve successfully completed the tutorial.
You should now have a good practice using Kibana to analyze real issues with your services.
This concludes the series on Integrating your Go service with the ELK Stack. You should now have a decent understanding of:
- How to install & setup ELK
- How to use structured logging in your services
- How to create Kibana dashboards
- How to analyse production issues in the Kibana dashboard
Well Done & happy logging. 👌

Oldest comments (0)