
While developing web applications sometimes your client may need data visualization features such as graphs, charts, KPI etc.
There are various charting libraries available such as HighCharts, Apex charts, Plotly, Chart JS etc. Some of these libraries require licensed version.
Today we will see how to integrate Chart JS library in Angular application. Why I chose Chart JS because it's a complete open source and lightweight library.
Here is the official site of Chart JS.
Project Setup and Chart JS library installation
Let's begin with creating new Angular Project.
ng new ChartDemo
Once the app is created and all the dependencies are installed you can run your app using below command.
ng serve
To integrate Chart JS we need to install below libraries.
npm install ng2-charts --save
npm install chart.js --save
Chart JS is official library to plot charts. However valor software has developed a wrapper over this library to support chart JS in Angular framework and it is called ng2-charts.
Here is the link for ng2-charts from valor software.
Adding Bootstrap to Angular Project
We will also add bootstrap for responsive layout but it is optional.
npm install bootstrap
Once bootstrap is installed you need to add reference to bootstrap CSS in you style.css file
@import '~bootstrap/dist/css/bootstrap.min.css';
To use chart js in our application we need to import NgChartsModule in app module file.
app.module.ts
import { NgChartsModule } from 'ng2-charts';
import { NgModule } from '@angular/core';
import { BrowserModule } from '@angular/platform-browser';
import { NgChartsModule } from 'ng2-charts';
import { AppComponent } from './app.component';
import { LineComponent } from './components/line/line.component';
import { BarComponent } from './components/bar/bar.component';
import { PieComponent } from './components/pie/pie.component';
@NgModule({
  declarations: [
    AppComponent,
    LineComponent,
    BarComponent,
    PieComponent
  ],
  imports: [
    BrowserModule,
    NgChartsModule
  ],
  providers: [],
  bootstrap: [AppComponent]
})
export class AppModule { }
Creating Chart Components and Configuration
Let's create below components
ng g c components/line
ng g c components/bar
ng g c components/pie
Once all these components are in place we will need to configure chart inside each component. Let's begin with a bar chart component. Chart JS requires below properties to plot chart.
  @Input() chartData!: Array<any>;;
  @Input() chartLabels!: Array<any>;
  @Input() chartOptions: ChartConfiguration['options'];
  @Input() chartLegends!: boolean;
chartData [{ data: [], label:''}] - It is the data points to be displayed in chart. It has array of objects with data and label as properties of each object. We can add extra properties as well such as backgroundColor, borderColor etc.
chartLabels [ ] - labels to be displayed. It is an array of string values
chartLegends (true/false) - Displays name of each series of data.
chartOptions { } - These are extra options to customize chart. Example if we set responsive : true in chartOptions then chart Behaviour will be responsive in different devices. We can setup external plugins to customize chart.
Here is the bar chart component looks like
barchart.component.ts
import { Component, Input, OnInit } from '@angular/core';
import { ChartConfiguration } from 'chart.js';
@Component({
  selector: 'app-bar',
  templateUrl: './bar.component.html',
  styleUrls: ['./bar.component.css']
})
export class BarComponent implements OnInit {
  @Input() chartData!: any;
  @Input() chartLabels!: Array<any>;
  @Input() chartOptions: ChartConfiguration['options'];
  @Input() chartLegends!: boolean;
  constructor() { }
  ngOnInit(): void {
    console.log(this.chartData)
  }
}
And we are going to pass this properties to the canvas. ng2-chart uses "baseChart" directive to render chart on to the canvas.
<canvas baseChart

    [datasets]="chartData"

    [labels]="chartLabels"

    [options]="chartOptions"

    [legend]="chartLegends"

    [type]="'bar'">

</canvas>
We will initialize barChartConfig variable with below configuration in the app.component.ts file.
ngOnInit() {
this.barChartConfig = {
chartData: [
{
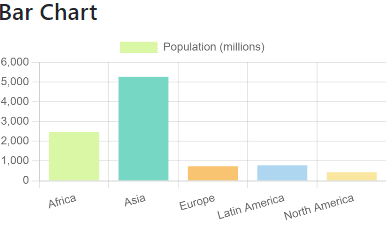
data: [2478,5267,734,784,433],
label: 'Population (millions)',
backgroundColor: ["#DAF7A6", "#76D7C4", "#F8C471", "#AED6F1", "#F9E79F"],
hoverBackgroundColor: ["#DAF7A6", "#76D7C4", "#F8C471", "#AED6F1", "#F9E79F"]
},
],
chartLabels: ["Africa", "Asia", "Europe", "Latin America", "North America"],
legends: true,
options: {
responsive: true,
}
}
}
Here we are showing population in millions so chartData array holds number of population data points and we are also passing backgroundColor and hoverBackground color properties. chartLabels property contains array of countries. Our complete bar chart will look like this.
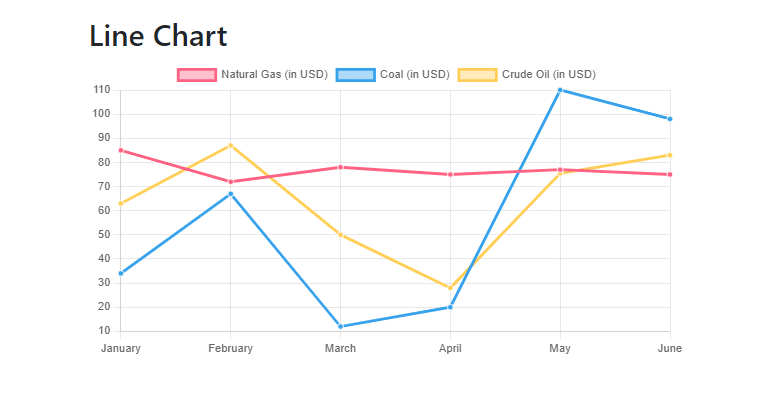
Let's plot line chart now. Here we will use same configuration but different data points. We will display oil, gas and coal prices for the current year.
Here is our line chart component looks like.
linechart.component.ts
import { Component, Input, OnInit } from '@angular/core';
import { ChartConfiguration } from 'chart.js';
@Component({
  selector: 'line-chart',
  templateUrl: './linechart.component.html',
  styleUrls: ['./linechart.component.css']
})
export class LinechartComponent implements OnInit {
  @Input() chartData!: any;
  @Input() chartLabels!: Array<any>;
  @Input() chartOptions: ChartConfiguration['options'];
  @Input() chartLegends!: boolean;

  constructor() { }
  ngOnInit(): void {
  }
}
We will set line chart configuration in app component.
this.lineChartConfig = {
      chartData: [
        { data: [85, 72, 78, 75, 77, 75], label: 'Natural Gas (in USD)'},
        { data: [34, 67, 12, 20, 110, 98], label: 'Coal (in USD)'},
        { data: [63, 87, 50, 28, 75.5, 83], label: 'Crude Oil (in USD)'}
      ],
      chartLabels: ['January', 'February', 'March', 'April', 'May', 'June'],
      legends: true,
      options: {
        responsive: true,
      }
 }
And here is the line chart component rendered with above configuration.
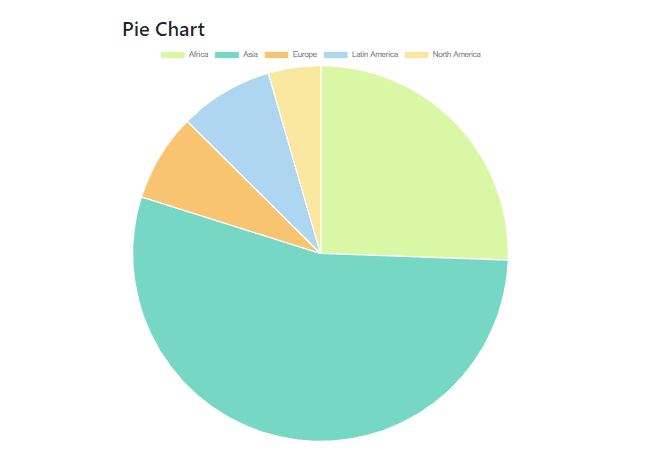
Hope you are enjoying this tutorial. We will plot out final pie chart showing population details of various countries.
Like bar and line chart we will use same component configuration here.
piechart.component.ts
import { Component, Input, OnInit } from '@angular/core';
import { ChartConfiguration } from 'chart.js';
@Component({
  selector: 'pie-chart',
  templateUrl: './piechart.component.html',
  styleUrls: ['./piechart.component.css']
})
export class PiechartComponent implements OnInit {
  @Input() chartData!: any;
  @Input() chartLabels!: Array<any>;
  @Input() chartOptions: ChartConfiguration['options'];
  @Input() chartLegends!: boolean;

  constructor() { }
  ngOnInit(): void {
  }
}
<canvas baseChart
    [datasets]="chartData"
    [labels]="chartLabels"
    [options]="chartOptions"
    [legend]="chartLegends"
    [type]="'pie'">
</canvas>
Below Pie Chart is showing detailed population across various countries.
Organize Chart Layout
Adding final finishing touch to our chart layout. We will display this charts in 6 x 6 columns using bootstrap grid layout. As our chart configuration uses responsive option these charts automatically resizes when switching to mobile layout.
app.component.html
<div class="container mt-5">
  <div class="row">
    <div class="col-md-6 col-12">
      <h2>Bar Chart</h2>
      <bar-chart [chartData]="barChartConfig.chartData" [chartLabels]="barChartConfig.chartLabels"
        [chartOptions]="barChartConfig.options" [chartLegends]="barChartConfig.legends"></bar-chart>
    </div>
    <div class="col-md-6  col-12">
      <h2>Line Chart</h2>
      <line-chart [chartData]="lineChartConfig.chartData" [chartLabels]="lineChartConfig.chartLabels"
        [chartOptions]="lineChartConfig.options" [chartLegends]="lineChartConfig.legends"></line-chart>
    </div>
  </div>
  <div class="row mt-2">
    <div class="col-md-6  col-12">
      <h2>Pie Chart</h2>
      <pie-chart [chartData]="pieChartConfig.chartData" [chartLabels]="pieChartConfig.chartLabels"
        [chartOptions]="pieChartConfig.options" [chartLegends]="pieChartConfig.legends"></pie-chart>
    </div>
  </div>
</div>
Here is the complete source code for this project.
References
https://valor-software.com/ng2-charts/#BarChart

Top comments (0)