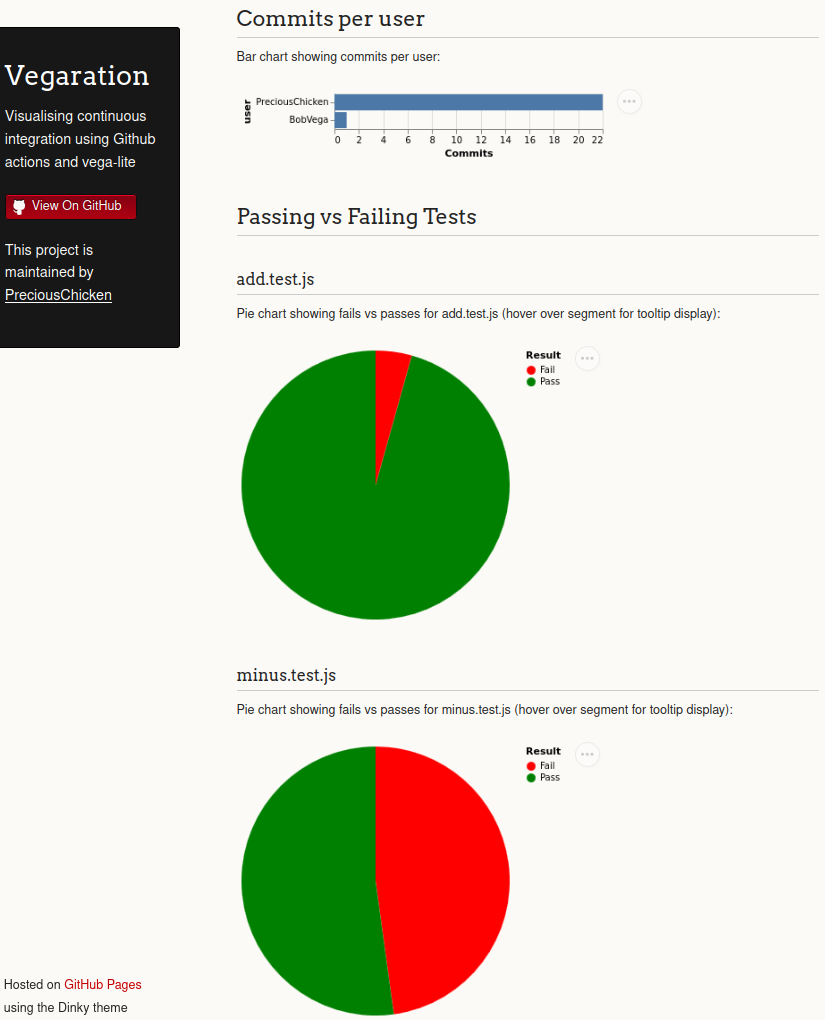
vegaration (noun) [vay-gah-grey-shuhn]: The use of vega-lite to visualise continuous integ-ration.
What I built
A tool to aid development teams by visualising Continuous Improvement. I used GitHub actions to log information about every commit made on a repo (e.g. user, sha, passing tests, failing tests) into a json file stored within the repo. This file was then used as the source for a number of visualisations implemented with the vega-lite specification. The same GitHub action workflow then published these visualisations to GitHub Pages so they could be viewed by all stakeholders.
This demonstration proves the possibility of logging and visualising a whole suite of Continuous Improvement metrics which could help teams identify patterns, address problems and increase efficiency. It differs from other CI visualisations (e.g. Jenkins) in the flexibility it offers: vega-lite is a data science tool meaning it offers a very wide range of visualisation possibilities; likewise logging via GitHub actions allows you the freedom to capture almost anything about the CI/CD process that your team is interested in.
Category Submission:
DIY Deployments
App Link
Continuous Integration Visualisation on GitHub Pages:
https://preciouschicken.github.io/vegaration/
Screenshots
Description
Visualising continuous integration using GitHub actions and vega-lite, natively hosted on GitHub Pages.
Link to Source Code
GitHub repository:
https://github.com/PreciousChicken/vegaration
Permissive License
MIT
Background (What made you decide to build this particular app? What inspired you?)
The integration of GitHub Actions and Vega-Lite to visualise continuous integration for software development offers a highly useful and beneficial approach for several reasons.
Firstly, it allows developers to gain a comprehensive and real-time understanding of the continuous integration process by providing visual representations of various metrics. These visualisations make it easier to identify patterns, trends, and potential issues at a glance, enabling faster and more efficient decision-making. This then enhances the ability of a team to track progress, evaluate the impact of changes, and identify areas for improvement.
Secondly, by integrating the visualisation directly into the software development workflow, teams can foster a culture of transparency and collaboration. Developers, project managers, and stakeholders can all access and interpret the visualisations, enabling a shared understanding and facilitating communication.
Ultimately, the combination of GitHub Actions and vega-Lite empowers software development teams to make data-driven decisions, streamline processes, and ensure the delivery of high-quality software.
How I built it (How did you utilize GitHub Actions or GitHub Codespaces? Did you learn something new along the way? Pick up a new skill?)
I utilised GitHub actions, GitHub Pages and the vega-lite visualisation specification. I learnt lots about all three in the process! I did consider using vega rather than vega-lite, but after trying both out decided for the higher-level grammar.
Additional Resources/Info
Worked example / Step-by-step guide:
https://dev.to/preciouschicken/vegaration-visualising-continuous-integration-using-github-actions-and-vega-lite-a97

Top comments (0)