Introduction
vegaration (noun) [vay-gah-grey-shuhn]: The use of vega-lite to visualise continuous integ-ration.
This is a worked example for Linux which aims to visualise the software development practice of continuous integration (CI). It uses GitHub actions to manage the CI workflow and vega-lite as the visualisation specification. Or to put it simply: every time someone commits to a repository on GitHub we can log elements associated with their commit (e.g. what tests passed, what tests failed) and then present this data visually using a wide suite of open-source metrics.
This demonstration proves the possibility of logging and visualising a whole suite of Continuous Improvement metrics which could help teams identify patterns, address problems and increase efficiency. The example created here, which can be viewed on the Vegaration GitHub Page, offers a very small slice of the total possibilities on offer. It differs from other CI visualisations (e.g. Jenkins) in the flexibility it offers: vega-lite is a data science tool meaning it offers a very wide range of visualisation possibilities; likewise logging via GitHub actions allows you the freedom to capture almost anything about the CI/CD process that your team is interested in.
All code is contained in the repo PreciousChicken/vegaration.
This was written using Manjaro Linux 22.1.1, node v16.13.2, vega-lite 5.9.1 and npm v8.3.2.
Create the GitHub repo
The first step is creating a new repo on GitHub as demonstrated:
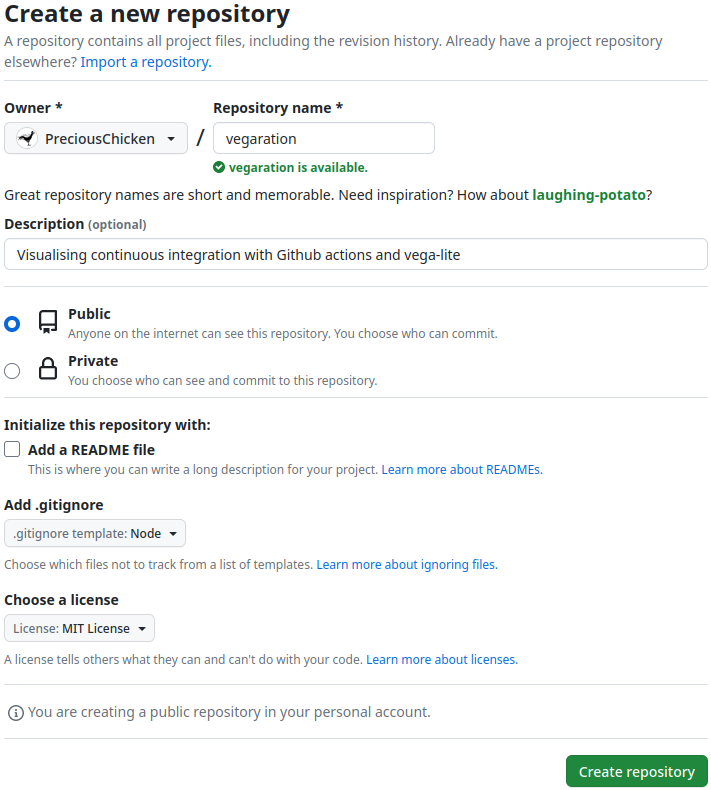
Ensure as you do so you set set the .gitignore option to Node. Readme is of course optional.
Clone into the repo
At the terminal clone into the repo using the following command - replacing the repo with the one created at the step above.
git clone git@github.com:PreciousChicken/vegaration.git
And then change directory into the repo you have created, e.g.:
cd vegaration
Testing...
Installing jest
To demonstrate the continuous integration it is necessary to create some mock tests. The Jest framework will be our testing weapon of choice, so at the command line enter:
npm i jest --save-dev
This will install the jest package, but we now need to add the test script to our package.json file which should be amended to look like this (the jest version will naturally be different depending on whatever is current):
{
  "devDependencies": {
    "jest": "^29.5.0"
  },
  "scripts": {
    "test": "jest"
  }
}
The tests
Now to create some simple functions and associated tests, nothing too complex. Create a file called add.js and paste the following:
function sum(a, b) {
  return a + b;
}
module.exports = sum;
And then create the associated test file add.test.js and paste:
const sum = require('./add');

test('adds 1 + 1 to equal 2', () => {
  expect(sum(1, 1)).toBe(2);
});
We may as well do subtraction too, so create a file called minus.js and paste:
function subtract(a, b) {
  return a - b;
}
module.exports = subtract;
and the associated test file minus.test.js with the following:
const subtract = require('./minus');

test('substract 2 - 1 to equal 1', () => {
  expect(subtract(2, 1)).toBe(1);
});
That now gives us two functions and two tests. Try them out by entering npm test at the terminal, and assuming copy and paste worked out, then jest should recognise the test files and both tests should pass with flying colours.
Hosting the visualisation on GitHub pages
Our visualisation has to be hosted somewhere - and it makes sense to use GitHub pages. To make things not so bare-bones we are going to ornament these with the Dinky theme, but it makes little difference.
Base
Create a folder to base the GitHub pages and then switch to it:
mkdir visualisation && cd visualisation
Typically this folder gets called Docs, but being descriptive is never a bad thing.
Create a configuration file for the GitHub pages named _config.yml (yes, it does start with an underscore) and paste:
theme: jekyll-theme-dinky
title: Vegaration
description: Visualising continuous integration using Github actions and vega-lite
Vega-liteify
To allow vega-lite visualisations to be embedded the GitHub pages need to know where to look to understand the visualisation, so create a new folder (again starting with an underscore) within the visualisations folder and switch to it:
mkdir _includes && cd _includes
Then create the file head-custom.html and paste:
<script src="https://cdn.jsdelivr.net/npm/vega@5"></script>
<script src="https://cdn.jsdelivr.net/npm/vega-lite@5"></script>
<script src="https://cdn.jsdelivr.net/npm/vega-embed@6"></script>
This snippet correspondingly gets picked up by the theme and entered within the <head> section of the finalised HTML (if we weren't using a theme we would place it directly in the <head>, but given we are using Dinky this is much neater).
The visualisation
Returning to our visualisation folder:
cd ..
we are going to create the file which will actually craft our visualisation, which is a mix of markdown and HTML as allowed by Jekyll (the engine which runs GitHub pages). This is where we will place the vega-lite specification which will create the embedded charts. This worked example is not going to dive into the vega-lite specification itself, for that you are probably best starting at the vega-lite tutorial. That said create the file index.md and paste:
---
title: Continuous Integration Visualisation
---

## Commits per user

Bar chart showing commits per user:

<div id="commitsPerUser"></div>

<script type="text/javascript">
    var commitsPerUser = {
        "$schema": "https://vega.github.io/schema/vega-lite/v5.json",
        "description": "Bar chart showing commits per user.",
        "config": {
        "background": "#FBFAF7"
        },
        "width": 300,
        "data": {"url": "./log.json"},
        "transform": [
        {
        "aggregate": [{
        "op": "count",
        "field": "sha",
        "as": "Commits"
        }],
        "groupby": ["user"]
        }
        ],
        "mark": "bar",
        "encoding": {
        "x": {"field": "Commits", "type": "quantitative",
        "axis": {"tickMinStep": 1}
        },
        "y": {"field": "user", "type": "nominal", "sort": "descending"}
        }
        };
    vegaEmbed('#commitsPerUser',commitsPerUser);
</script>

## Passing vs Failing Tests

### add.test.js

Pie chart showing fails vs passes for add.test.js (hover over segment for tooltip display):

<div id="addPie"></div>

<script type="text/javascript">
    var addPie = {
        "$schema": "https://vega.github.io/schema/vega-lite/v5.json",
        "data": {"url": "./log.json"},
        "description": "Pie chart showing pass vs fail for add_test_js",
        "config": {
        "background": "#FBFAF7"
        },
        "transform": [
        {"filter": {"field": "add_test_js", "oneOf": ["FAIL", "PASS"]}},
        {"aggregate": [{"op": "count", "as": "count"}], "groupby": ["add_test_js"]}
        ],
        "mark": {
        "type": "arc",
        "tooltip": true
        },
        "encoding": {
        "theta": {"field": "count", "type": "quantitative"},
        "color": {
        "field": "add_test_js",
        "type": "nominal",
        "scale": {
        "domain": ["FAIL", "PASS"],
        "range": ["red", "green"]
        },
        "legend": {
        "title": "Result",
        "labelExpr": "datum.value === 'FAIL' ? 'Fail' : 'Pass'"
        }
        },
        "tooltip": [
        {"field": "count", "type": "quantitative"},
        {"field": "add_test_js", "type": "nominal"}
        ],
        "text": {"field": "count", "type": "quantitative"}
        },
        "width": 300,
        "height": 300
        };
    vegaEmbed('#addPie', addPie);
</script>


### minus.test.js

Pie chart showing fails vs passes for minus.test.js (hover over segment for tooltip display):

<div id="minusPie"></div>

<script type="text/javascript">
    var minusPie = {
        "$schema": "https://vega.github.io/schema/vega-lite/v5.json",
        "data": {"url": "./log.json"},
        "description": "Pie chart showing pass vs fail for minus_test_js",
        "config": {
        "background": "#FBFAF7"
        },
        "transform": [
        {"filter": {"field": "minus_test_js", "oneOf": ["FAIL", "PASS"]}},
        {"aggregate": [{"op": "count", "as": "count"}], "groupby": ["minus_test_js"]}
        ],
        "mark": {
        "type": "arc",
        "tooltip": true
        },
        "encoding": {
        "theta": {"field": "count", "type": "quantitative"},
        "color": {
        "field": "minus_test_js",
        "type": "nominal",
        "scale": {
        "domain": ["FAIL", "PASS"],
        "range": ["red", "green"]
        },
        "legend": {
        "title": "Result",
        "labelExpr": "datum.value === 'FAIL' ? 'Fail' : 'Pass'"
        }
        },
        "tooltip": [
        {"field": "count", "type": "quantitative"},
        {"field": "minus_test_js", "type": "nominal"}
        ],
        "text": {"field": "count", "type": "quantitative"}
        },
        "width": 300,
        "height": 300
    };
    vegaEmbed('#minusPie', minusPie);
</script>
Lastly we need to create a placeholder file where as commits are made data is placed so that it can be visualised; therefore in the same visualisation folder create the file log.json and paste:
[
]
Committed
The rest of the steps that need to take place happen on the GitHub site, so we should commit and push the code we have written so far:
cd ..
git add .
git commit -m "Initial commit"
git push
Action, man
So now we have lined up our tests and the visualisation that shows us information every time they run. The next step is to link these up with a GitHub action. This action will run every time there is a commit to the repo and will:
- Run the tests 1
- Log the results of the test in log.json
- Publish an updated version of the visualisation on GitHub pages
This workflow however is best created from the GitHub website itself. Therefore navigate to the Settings on your online repo and then select Pages from Code and automation. Under the heading Build and deployment select the GitHub Actions from the Source dropdown menu and then click on the create your own link as shown:
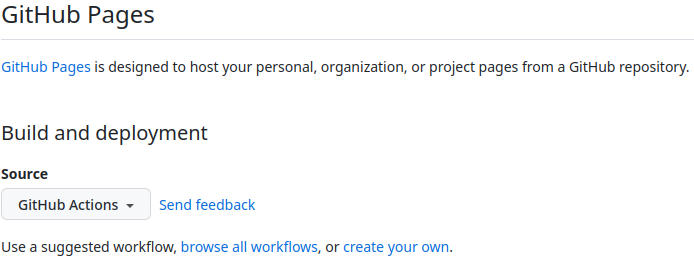
You will then be taken to the code editor online, in the box entitled Name your file... paste the filename visualisation.yml and then in the main Edit body of the code editor itself delete the default contents and paste:
name: Visualising continuous integration

on:
  # Runs on pushes targeting the default branch
  push:
    branches: ["main"]

  # Allows you to run this workflow manually from the Actions tab
  workflow_dispatch:

env:
  # set this to the node version to use if not 16
  NODE_VERSION: '16.x'

# Sets permissions of the GITHUB_TOKEN to allow deployment to GitHub Pages
permissions:
  contents: write
  pages: write
  id-token: write

# Allow only one concurrent deployment, skipping runs queued between the run in-progress and latest queued.
# However, do NOT cancel in-progress runs as we want to allow these production deployments to complete.
concurrency:
  group: "pages"
  cancel-in-progress: false

jobs:
  # Saves results of tests
  output_test:
    runs-on: ubuntu-latest
    steps:
      - name: Checkout
        uses: actions/checkout@v3
      - name: Set up Node.js
        uses: actions/setup-node@v3
        with:
          node-version: ${{ env.NODE_VERSION }}
          cache: 'npm'
      - name: npm install
        run: npm ci
      - name: Run tests and add to log file
        run: |
          # Create an shell variable called `tests` and add git commit sha
          tests="{\"sha\": \"${{ toJSON(github.sha) }}\", "
          # Run npm test and append test results to `tests` variable
          # Uses grep to remove all test results apart from FAIL / PASS and test
          # Awk used to write to file and replace filename periods with underscores
          # Vega-lite does not play well with periods, so add.test.js -> add_test_js
          tests+=$(npm test 2>&1 >/dev/null | grep 'FAIL\|PASS' | awk '
            {
            js = gensub(/^\.\/(\w*)\.(\w*)\.(\w*)/, "\\1_\\2_\\3" ,"g", $2)
            printf("\"" js"\": \""$1"\", ")
          }')
          # Appends github user name to `tests` shell variable
          tests+="\"user\": \"${{ toJSON(github.actor) }}\"}"
          # Shell variable `tests` appended to end of log.json
          awk -i inplace -v env_var="$tests" -v RS='^$' -v ORS= '{
            print gensub(/\[/,"[\n  "env_var",","g")
            }' visualisation/log.json
          # Ensure no trailing commas at end of log.json
          awk -i inplace -v RS='^$' -v ORS= '{
            print gensub(/,\n\]/,"\n]","g")
          }' visualisation/log.json
      - name: Push updated log
        run: |
          # Should be changed to name of user listed in repo
          git config user.name PreciousChicken
          # Should be changed to email of user listed in repo
          git config user.email hello@preciouschicken.com
          git add .
          git commit -m "Auto-generated by github actions"
          git push
  # Build job
  build:
    runs-on: ubuntu-latest
    needs: output_test
    steps:
      - name: Checkout
        uses: actions/checkout@v3
      - name: Setup Pages
        uses: actions/configure-pages@v3
      - name: Build with Jekyll
        uses: actions/jekyll-build-pages@v1
        with:
          source: ./visualisation/
          destination: ./_site
      - name: Upload artifact
        uses: actions/upload-pages-artifact@v1

  # Deployment job
  deploy:
    environment:
      name: github-pages
      url: ${{ steps.deployment.outputs.page_url }}
    runs-on: ubuntu-latest
    needs: build
    steps:
      - name: Deploy to GitHub Pages
        id: deployment
        uses: actions/deploy-pages@v2
There are two lines in the above that will need to be changed dependent on the repo you are using. These are: git config user.name PreciousChicken and git config user.email hello@preciouschicken.com, change to whatever is appropriate for your repo.
Once you have pasted this into the online code editor and made the changes, click the Commit changes... button and commit directly to the main branch. At time of writing there is a bug which will trigger two workflow runs, of which the second will fail. However future pushes onto the branch should work correctly.
You'll notice a fair amount of RegEx used and old school tools such as grep and awk2, which serve to capture the test results and append this data to the log.json as a new line each time a commit is run. The appended line looks something like this:
{"sha": "a0d7b73dfb0c5273e6dceb380e7568dfe735d65b", "minus_test_js": "FAIL", "add_test_js": "PASS", "user": "PreciousChicken"},
Of course this capture could have been achieved with something like Python, but seen as the GitHub workflow runs on an Ubuntu virtual machine, GNU tools work just fine. They also have the advantage that you are implementing all the logic in the workflow itself, which is arguably more transparent and portable.
NB - If you have sharp eyes you might notice that the filename periods have been changed to underscores in the json e.g. minus.test.js to minus_test_js. This is because vega-lite does not play well with field names that include periods, so to avoid complications these have been swapped out.
Results and Conclusion
From this point on any further commits will cause the GitHub action to run, the tests to be activated and log.json to get a new entry, which will be visualised by the vega-lite embedded in the GitHub pages. This will result in a visualisation that looks similar to this:
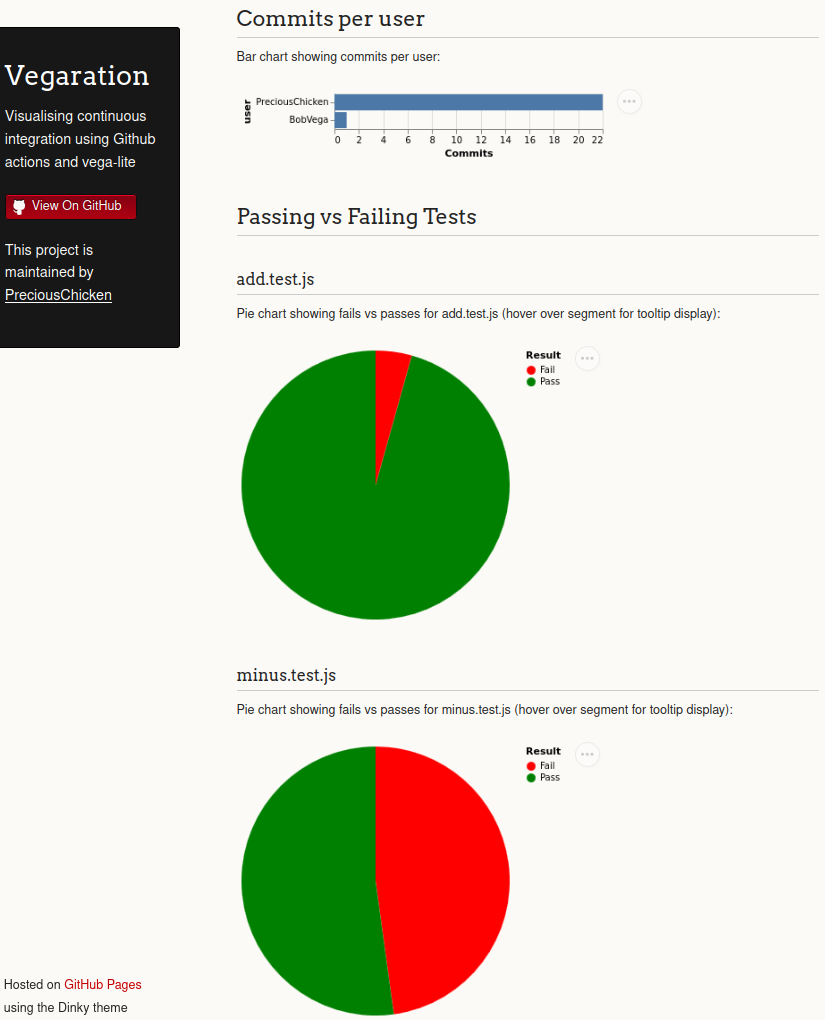
It is worth noting it can take some time for this page to be updated; indeed possibly about ten minutes on first creation according to this StackOverflow answer.
Clearly this particular visualisation may not have any particular benefit for your project (although seeing which tests are failing more than others and who is the most active participant, might be of use). However given the flexibility of vega-lite and the option to log just about anything you would want with GitHub actions, there are literally limitless use cases.
Feedback? Please leave a message below. If you like what I've done here please take a moment to star the repo and let me know.
-
Normally failing tests would halt the progress of GitHub actions - for good reason - a failed test probably means you do not want to deploy. As this was a visualisation however which was intended to capture both passing and failing tests, although the tests were run their results were captured in a shell environment variable, rather than being outputted to standard output / standard error which would have halted the workflow. In a production system therefore you would want a seperate workflow which is actually running the tests in their normal manner allowing a return to standard output / standard error. ↩
-
Grep was probably redundant and I could have used awk for everything, but it seemed simpler to use both in this instance. ↩

Top comments (0)