
The Problem
We are given a table called Queries with the following structure:
| Column Name | Type |
|---|---|
| query_name | varchar |
| result | varchar |
| position | int |
| rating | int |
This table contains information collected from some queries on a database. The position column ranges from 1 to 500, and the rating column ranges from 1 to 5. Queries with a rating less than 3 are considered as poor.
We define two metrics:
- Query quality: the average ratio of query rating to its position.
- Poor query percentage: the percentage of all queries with a rating less than 3.
The task is to write an SQL query that calculates these metrics for each query_name. Both should be rounded to 2 decimal places.
Example:
Input:
Queries table:
| query_name | result | position | rating |
|---|---|---|---|
| Dog | Golden Retriever | 1 | 5 |
| Dog | German Shepherd | 2 | 5 |
| Dog | Mule | 200 | 1 |
| Cat | Shirazi | 5 | 2 |
| Cat | Siamese | 3 | 3 |
| Cat | Sphynx | 7 | 4 |
Output:
| query_name | quality | poor_query_percentage |
|---|---|---|
| Dog | 2.50 | 33.33 |
| Cat | 0.66 | 33.33 |
The Solution
We'll discuss four SQL solutions with varying degrees of complexity. The key difference among these solutions is the SQL features they rely on, such as window functions, conditional aggregates, and distinct values.
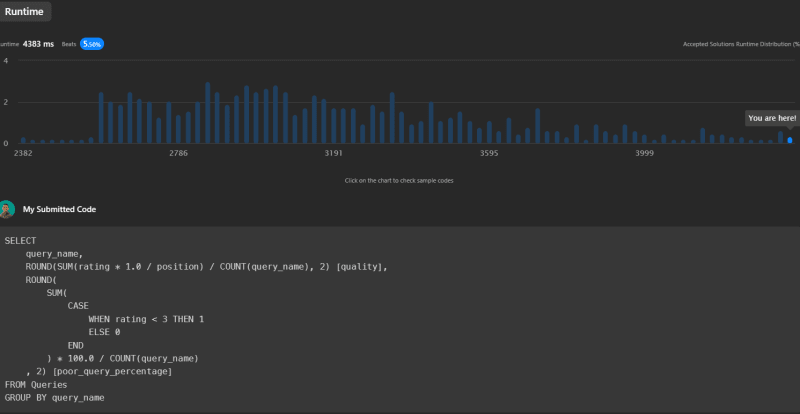
Source Code 1: Simple Aggregation
This approach uses simple SQL aggregates and a conditional count to calculate the metrics.
SELECT
    query_name,
    ROUND(SUM(rating * 1.0 / position) / COUNT(query_name), 2) AS quality,
    ROUND(
        SUM(
            CASE
                WHEN rating < 3 THEN 1
                ELSE 0
            END
        ) * 100.0 / COUNT(query_name)
    , 2) AS poor_query_percentage
FROM Queries
GROUP BY query_name
Runtime: 4383ms, beats 5.50% of submissions on LeetCode.
Source Code 2: Window Functions
This solution utilizes window functions, which allow calculations across a set of rows related to the current row. This makes the solution more flexible and potentially more efficient.
SELECT DISTINCT
    query_name,
    ROUND(
        SUM(rating * 1.0 / position) OVER (PARTITION BY query_name)
        / COUNT(query_name) OVER (PARTITION BY query_name)
    , 2) AS quality,
    ROUND(
        SUM(
            CASE
                WHEN rating < 3 THEN 1
                ELSE 0
            END
        )  OVER (PARTITION BY query_name)
        * 100.0 / COUNT(query_name)  OVER (PARTITION BY query_name)
    ,

2) AS poor_query_percentage
FROM Queries
Runtime: 3440ms, beats 30.10% of submissions on LeetCode.

Source Code 3: Window Functions with Average
This approach also uses window functions but incorporates the AVG function for a more straightforward calculation of the quality metric.
SELECT DISTINCT
    query_name,
    ROUND(AVG(rating * 1.0 / position) OVER (PARTITION BY query_name), 2) AS quality,
    ROUND(
        SUM(
            CASE
                WHEN rating < 3 THEN 1
                ELSE 0
            END
        )  OVER (PARTITION BY query_name)
        * 100.0 / COUNT(query_name)  OVER (PARTITION BY query_name)
    , 2) AS poor_query_percentage
FROM Queries
Runtime: 4158ms, beats 8.48% of submissions on LeetCode.

Source Code 4: Aggregation with Average
This solution resembles the first one, but it replaces the complex sum expression with the AVG function for the quality calculation, improving readability.
SELECT
    query_name,
    ROUND(AVG(rating * 1.0 / position), 2) AS quality,
    ROUND(
        SUM(
            CASE
                WHEN rating < 3 THEN 1
                ELSE 0
            END
        ) * 100.0 / COUNT(query_name)
    , 2) AS poor_query_percentage
FROM Queries
GROUP BY query_name
Runtime: 4284ms, beats 6.76% of submissions on LeetCode.

Conclusion
Each solution offers unique insights into SQL coding strategies, showcasing the trade-offs between readability and performance. Among the four, Source Code 2 provides the best performance in the LeetCode environment. However, please note that actual performance may vary in a real-world RDBMS due to factors like data distribution and indexing.
Ranked from the best to worst based on the LeetCode benchmark:
- Source Code 2
- Source Code 3
- Source Code 4
- Source Code 1
You can find the original problem at LeetCode.
For more insightful solutions and tech-related content, feel free to connect with me on my Beacons page.

ranggakd - Link in Bio & Creator Tools | Beacons
@ranggakd | center details summary summary Oh hello there I m a an Programmer AI Tech Writer Data Practitioner Statistics Math Addict Open Source Contributor Quantum Computing Enthusiast details center.

Top comments (0)