I’ve written previously about ingesting syslog into Kafka and using KSQL to analyse it. I want to revisit the subject since it’s nearly two years since I wrote about it and some things have changed since then.
ksqlDB now includes the ability to define connectors from within it, which makes setting things up loads easier.
You can find the full rig to run this on GitHub.
Create and configure the syslog connector
To start with, create a source connector:
CREATE SOURCE CONNECTOR SOURCE_SYSLOG_UDP_01 WITH (
    'tasks.max' = '1',
    'connector.class' = 'io.confluent.connect.syslog.SyslogSourceConnector',
    'topic' = 'syslog',
    'syslog.port' = '42514',
    'syslog.listener' = 'UDP',
    'syslog.reverse.dns.remote.ip' = 'true',
    'confluent.license' = '',
    'confluent.topic.bootstrap.servers' = 'kafka:29092',
    'confluent.topic.replication.factor' = '1'
);
This creates a Kafka Connect syslog connector, running either on the embedded Kafka Connect worker on ksqlDB, or an external Kafka Connect worker (which is what I’m using).
Check that the connector is working (the State should be RUNNING):
ksql> DESCRIBE CONNECTOR SOURCE_SYSLOG_UDP_01;

Name : SOURCE_SYSLOG_UDP_01
Class : io.confluent.connect.syslog.SyslogSourceConnector
Type : source
State : RUNNING
WorkerId : kafka-connect-01:8083

 Task ID | State | Error Trace
---------------------------------
 0 | RUNNING |
---------------------------------
ksql>
And now test it out by sending a dummy syslog message from the shell prompt via netcat (nc):
echo "<34>1 2019-12-18T22:14:15.003Z asgard.example.com su - ID47 - Your tea is brewing" | nc -u localhost 42514
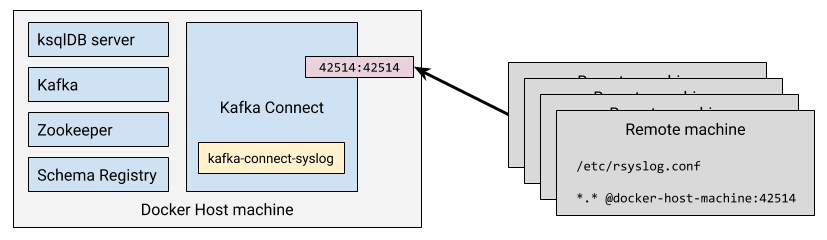
Don’t forget your networking in all this - if you’re running Kafka Connect in a container then you need to open up the inbound port. Also note that I’m using UDP so you have to use -u with netcat (nc).
You can examine the Kafka topic that the syslog message is written to with PRINT:
ksql> PRINT syslog FROM BEGINNING;
Format:AVRO
12/18/19 10:14:15 PM UTC, $asgard.example.com, {"name": null, "type": "RFC5424", "message": "Your tea is brewing", "host": "asgard.example.com", "version": 1, "level": 2, "tag": null, "extension": null, "severity": null, "appName": "su", "facility": 4, "remoteAddress": "172.25.0.1", "rawMessage": "<34>1 2019-12-18T22:14:15.003Z asgard.example.com su - ID47 - Your tea is brewing\n", "processId": null, "messageId": "ID47", "structuredData": null, "deviceVendor": null, "deviceProduct": null, "deviceVersion": null, "deviceEventClassId": null, "date": 1576707255003}
Assuming this is working you can now update your actual devices to route their syslog data to the machine on which Kafka Connect is running. Here’s an example of the necessary configuration for rsyslog:
*.* @proxmox01.moffatt.me:42514
As before, pay attention to your network. If the machines are external to the host machine running Docker (and Kafka Connect is in a container) then you need to use the host machine’s name (proxmox01.moffatt.me in the above example) to route the traffic, and ensure that the Docker container has its port published to the host.
Working with syslog data in ksqlDB
The first thing to do is register this Kafka topic with ksqlDB:
CREATE STREAM SYSLOG WITH (KAFKA_TOPIC='syslog', VALUE_FORMAT='AVRO');
Once registered, we can run SQL commands against it:
ksql> SELECT * FROM SYSLOG EMIT CHANGES;
+------+------+------+------+------+------+------+------+------+------+------+------+------+------+------+------+------+------+------+------+------+------+------+
|ROWTIM|ROWKEY|NAME  |TYPE  |MESSAG|HOST  |VERSIO|LEVEL |TAG   |EXTENS|SEVERI|APPNAM|FACILI|REMOTE|RAWMES|PROCES|MESSAG|STRUCT|DEVICE|DEVICE|DEVICE|DEVICE|DATE  |
|E     |      |      |      |E     |      |N     |      |      |ION   |TY    |E     |TY    |ADDRES|SAGE  |SID   |EID   |UREDDA|VENDOR|PRODUC|VERSIO|EVENTC|      |
|      |      |      |      |      |      |      |      |      |      |      |      |      |S     |      |      |      |TA    |      |T     |N     |LASSID|      |
+------+------+------+------+------+------+------+------+------+------+------+------+------+------+------+------+------+------+------+------+------+------+------+
|157670|$     |null  |RFC542|Your t|asgard|1     |2     |null  |null  |null  |su    |4     |172.25|<34>1 |null  |ID47  |null  |null  |null  |null  |null  |157670|
|725500|asgard|      |4     |ea is |.examp|      |      |      |      |      |      |      |.0.1  |2019-1|      |      |      |      |      |      |      |725500|
|3     |.examp|      |      |brewin|le.com|      |      |      |      |      |      |      |      |2-18T2|      |      |      |      |      |      |      |3     |
|      |le.com|      |      |g     |      |      |      |      |      |      |      |      |      |2:14:1|      |      |      |      |      |      |      |      |
|      |      |      |      |      |      |      |      |      |      |      |      |      |      |5.003Z|      |      |      |      |      |      |      |      |
|      |      |      |      |      |      |      |      |      |      |      |      |      |      | asgar|      |      |      |      |      |      |      |      |
|      |      |      |      |      |      |      |      |      |      |      |      |      |      |d.exam|      |      |      |      |      |      |      |      |
|      |      |      |      |      |      |      |      |      |      |      |      |      |      |ple.co|      |      |      |      |      |      |      |      |
|      |      |      |      |      |      |      |      |      |      |      |      |      |      |m su -|      |      |      |      |      |      |      |      |
|      |      |      |      |      |      |      |      |      |      |      |      |      |      | ID47 |      |      |      |      |      |      |      |      |
|      |      |      |      |      |      |      |      |      |      |      |      |      |      |- Your|      |      |      |      |      |      |      |      |
|      |      |      |      |      |      |      |      |      |      |      |      |      |      | tea i|      |      |      |      |      |      |      |      |
|      |      |      |      |      |      |      |      |      |      |      |      |      |      |s brew|      |      |      |      |      |      |      |      |
|      |      |      |      |      |      |      |      |      |      |      |      |      |      |ing
Selecting specific fields from a Kafka message
There’s a lot of columns in here that we’re not so interested in. Because we’re in the land of SQL and schemas, we can just specify the columns that we do want (pulling from the live Kafka topic of syslog data as it arrives):
ksql> SELECT TIMESTAMPTOSTRING(DATE, 'yyyy-MM-dd HH:mm:ss') AS SYSLOG_TS,
             HOST,
             FACILITY,
             MESSAGE,
             REMOTEADDRESS
        FROM SYSLOG
        EMIT CHANGES;
+--------------------+-------------------+---------+--------------------+--------------+
|SYSLOG_TS           |HOST               |FACILITY |MESSAGE             |REMOTEADDRESS |
+--------------------+-------------------+---------+--------------------+--------------+
|2019-12-18 22:14:15 |asgard.example.com |4        |Your tea is brewing |172.25.0.1    |
…
Enriching Kafka messages with joins in ksqlDB
We can also make things easier to understand by building a reference table for the FACILITY code based on the syslog RFC. This creates and populates a Kafka topic, with a ksqlDB table registered on top of it.
CREATE TABLE FACILITY (ROWKEY STRING KEY, DESCRIPTION VARCHAR)
    WITH (KAFKA_TOPIC='facility',VALUE_FORMAT='AVRO', PARTITIONS=1);
INSERT INTO FACILITY VALUES ('0','kernel messages');
INSERT INTO FACILITY VALUES ('1','user-level messages');
INSERT INTO FACILITY VALUES ('2','mail system');
INSERT INTO FACILITY VALUES ('3','system daemons');
INSERT INTO FACILITY VALUES ('4','security/authorization messages');
INSERT INTO FACILITY VALUES ('5','messages generated internally by syslogd');
INSERT INTO FACILITY VALUES ('6','line printer subsystem');
…
With this table we can enhance the view that we get over the stream of data as it arrives:
ksql> SELECT TIMESTAMPTOSTRING(S.DATE, 'yyyy-MM-dd HH:mm:ss') AS SYSLOG_TS,
             S.HOST,
             F.DESCRIPTION AS FACILITY,
             S.MESSAGE,
             S.REMOTEADDRESS
        FROM SYSLOG S
             LEFT OUTER JOIN
             FACILITY F ON S.FACILITY=F.ROWKEY
     EMIT CHANGES;

+----------------+----------------+----------------+----------------+----------------+
|SYSLOG_TS       |HOST            |FACILITY        |MESSAGE         |REMOTEADDRESS   |
+----------------+----------------+----------------+----------------+----------------+
|2019-12-18 22:14|asgard.example.c|security/authori|Your tea is brew|172.25.0.1      |
|:15             |om              |zation messages |ing             |                |
Note: You can also use CASE to enrich fields; for a short list of hard-coded values like these from the RFC one might consider doing this instead:
SELECT […]
       CASE WHEN FACILITY=0 THEN 'kernel messages'
            WHEN FACILITY=1 THEN 'user-level messages'
            WHEN FACILITY=2 THEN 'mail system'
            ELSE '<unknown>'
        END AS FACILITY_DESCRIPTION
        […]
   FROM SYSLOG EMIT CHANGES;
Processing existing Kafka data
But wait! Someone told me that Apache Kafka stores data and doesn’t delete it just because someone consumed it. We can query existing data on the topic too, by telling ksqlDB to start its query at the beginning:
SET 'auto.offset.reset' = 'earliest';
Now we get to see all the messages on the topic!
ksql> SELECT TIMESTAMPTOSTRING(S.DATE, 'yyyy-MM-dd HH:mm:ss') AS SYSLOG_TS,
             S.HOST,
             F.DESCRIPTION AS FACILITY,
             S.MESSAGE,
             S.REMOTEADDRESS
        FROM SYSLOG S
             LEFT OUTER JOIN
             FACILITY F ON S.FACILITY=F.ROWKEY
     EMIT CHANGES;

+----------------+----------------+----------------+----------------+----------------+
|SYSLOG_TS       |HOST            |FACILITY        |MESSAGE         |REMOTEADDRESS   |
+----------------+----------------+----------------+----------------+----------------+
|2019-12-18 12:31|usgmoffattme    |messages generat|set SCM_CREDENTI|172.25.0.1      |
|:58             |                |ed internally by|ALS failed on '/|                |
|                |                | syslogd        |dev/log': Protoc|                |
|                |                |                |ol not available|                |
|2019-12-18 12:31|usgmoffattme    |kernel messages |imklog 5.8.11, l|172.25.0.1      |
|:58             |                |                |og source = /pro|                |
|                |                |                |c/kmsg started. |                |
|2019-12-18 12:32|BZ2,dc9fdbec6a10|system daemons  |Logread connecte|172.25.0.1      |
|:00             |,v4.0.69.10871: |                |d to 192.168.10.|                |
|                |                |                |83:42514        |                |
|2019-12-18 22:14|asgard.example.c|security/authori|Your tea is brew|172.25.0.1      |
|:15             |om              |zation messages |ing             |                |
…
That’s quite a lot of messages and quite a lot of noise. Let’s filter this sucker down into messages just for a particular host:
ksql> SELECT TIMESTAMPTOSTRING(S.DATE, 'yyyy-MM-dd HH:mm:ss') AS SYSLOG_TS,
             F.DESCRIPTION AS FACILITY,
             S.MESSAGE AS MESSAGE
        FROM SYSLOG S
             LEFT OUTER JOIN
             FACILITY F ON S.FACILITY=F.ROWKEY
       WHERE S.HOST='rpi-03'
         EMIT CHANGES;

+---------------------+--------------------------------+--------------------------------+
|SYSLOG_TS            |FACILITY                        |MESSAGE                         |
+---------------------+--------------------------------+--------------------------------+
|2019-12-18 17:40:01  |security/authorization messages |Invalid user soledad from 40.73.|
|                     |                                |76.102                          |
|2019-12-18 17:40:01  |security/authorization messages |input_userauth_request: invalid |
|                     |                                |user soledad [preauth]          |
|2019-12-18 17:40:01  |security/authorization messages |Received disconnect from 40.73.7|
|                     |                                |6.102: 11: Bye Bye [preauth]    |
|2019-12-18 17:40:01  |clock daemon                    |(smmsp) CMD (test -x /etc/init.d|
|                     |                                |/sendmail && /usr/share/sendmail|
|                     |                                |/sendmail cron-msp)             |
|2019-12-18 17:40:01  |security/authorization messages |pam_unix(cron:session): session |
|                     |                                |opened for user root by (uid=0) |
|2019-12-18 17:40:01  |mail system                     |My unqualified host name (rpi-03|
|                     |                                |) unknown; sleeping for retry   |
Turns out this machine is open to the big bad internet and is being routinely probed and brute-force SSH attempts made on it. This is interesting stuff to analyse and understand what’s happening as it happens—which is why stream processing is so very useful in this space. Let’s create a new Kafka topic populated just with any SSH login attempts:
CREATE STREAM SYSLOG_INVALID_USERS AS
        SELECT *
        FROM SYSLOG
        WHERE MESSAGE LIKE 'Invalid user%';
The stream is backed by a new Kafka topic:
ksql> SHOW TOPICS;

 Kafka Topic                     | Partitions | Partition Replicas
-------------------------------------------------------------------
[…]
 syslog                          | 1          | 1
 SYSLOG_INVALID_USERS            | 1          | 1
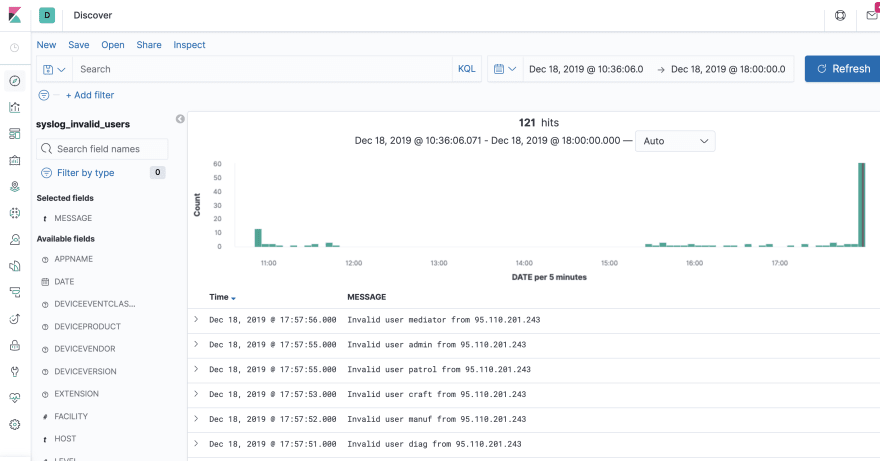
The stream only has messages on it that match the pattern above that we’ve used to identify attempted SSH logins:
ksql> SELECT TIMESTAMPTOSTRING(DATE, 'yyyy-MM-dd HH:mm:ss') AS SYSLOG_TS,
              HOST,
              MESSAGE
          FROM SYSLOG_INVALID_USERS
          EMIT CHANGES;
+--------------------+--------------+--------------------------------------------+
|SYSLOG_TS           |HOST          |MESSAGE                                     |
+--------------------+--------------+--------------------------------------------+
|2019-12-18 12:51:26 |usgmoffattme  |Invalid user foo from 192.168.10.83         |
|2019-12-18 15:55:21 |rpi-03        |Invalid user dbus from 51.254.140.235       |
|2019-12-18 15:55:30 |rpi-03        |Invalid user tchs from 192.34.62.227        |
|2019-12-18 16:02:58 |rpi-03        |Invalid user postgres from 103.101.52.48    |
|2019-12-18 16:09:29 |rpi-03        |Invalid user umns from 192.34.62.227        |
We can process the live stream of data further, using SPLIT and REPLACE functions to parse the MESSAGE fields to create an array:
ksql> SELECT SPLIT(REPLACE(MESSAGE,'Invalid user ',''),' from ') AS ATTACK_DETAILS FROM SYSLOG_INVALID_USERS EMIT CHANGES LIMIT 1;
+------------------------+
|ATTACK_DETAILS          |
+------------------------+
|[foo, 192.168.10.83]    |
Limit Reached
Query terminated
Based on this we can create a second new stream, derived from the first:
CREATE STREAM SSH_ATTACKS AS
    SELECT TIMESTAMPTOSTRING(DATE, 'yyyy-MM-dd HH:mm:ss') AS SYSLOG_TS,
           HOST,
           SPLIT(REPLACE(MESSAGE,'Invalid user ',''),' from ')[0] AS ATTACK_USER,
           SPLIT(REPLACE(MESSAGE,'Invalid user ',''),' from ')[1] AS ATTACK_IP
      FROM SYSLOG_INVALID_USERS
      EMIT CHANGES;
Now we have a ksqlDB stream of all attempted logins, with the IP and user ID that was used. This includes all historic data, and any new events as they occur:
ksql> SELECT SYSLOG_TS, HOST, ATTACK_USER, ATTACK_IP FROM SSH_ATTACKS EMIT CHANGES;
+--------------------+-------------+------------+--------------+
|SYSLOG_TS           |HOST         |ATTACK_USER |ATTACK_IP     |
+--------------------+-------------+------------+--------------+
|2019-12-18 12:51:26 |usgmoffattme |foo         |192.168.10.83 |
|2019-12-18 13:02:39 |usgmoffattme |oracle      |192.168.10.83 |
|2019-12-18 13:02:43 |usgmoffattme |oracle      |192.168.10.83 |
|2019-12-18 13:02:50 |usgmoffattme |vncserver   |192.168.10.83 |
…
Let’s take a moment to appreciate what we’ve built here. We’ve taken a stream of syslog events…
…
{"name": null, "type": "RFC3164", "message": ": stahtd[2991]: [STA-TRACKER].stahtd_dump_event(): {\"query_30\":\"unifi.moffatt.me.\",\"message_type\":\"STA_ASSOC_TRACKER\",\"query_9\":\"unifi.moffatt.me.\",\"query_1\":\"b8-pkc-l6wr6.europe-west2.gcp.confluent.cloud.\",\"vap\":\"vwire5\",\"query_18\":\"b5-pkc-l6wr6.europe-west2.gcp.confluent.cloud.\",\"query_server_30\":\"192.168.10.1\",\"mac\":\"18:e8:29:eb:30:a0\",\"event_type\":\"dns timeout\",\"assoc_status\":\"0\",\"query_server_1\":\"192.168.10.1\",\"query_server_4\":\"192.168.10.1\",\"query_server_9\":\"192.168.10.1\",\"query_23\":\"api.eu.amazonalexa.com.\",\"query_server_8\":\"192.168.10.1\",\"query_3\":\"asimov.vortex.data.microsoft.com.akadns.net.\",\"query_server_3\":\"192.168.10.1\",\"query_4\":\"asimov.vortex.data.microsoft.com.akadns.net.\",\"query_8\":\"local.\",\"query_server_18\":\"192.168.10.1\",\"query_server_23\":\"192.168.10.1\"}", "host": "U7PG2,f09fc2238301,v4.0.69.10871:", "version": null, "level": 6, "tag": null, "extension": null, "severity": null, "appName": null, "facility": 1, "remoteAddress": "172.25.0.1", "rawMessage": "<14>Dec 18 12:51:24 U7PG2,f09fc2238301,v4.0.69.10871: : stahtd[2991]: [STA-TRACKER].stahtd_dump_event(): {\"query_30\":\"unifi.moffatt.me.\",\"message_type\":\"STA_ASSOC_TRACKER\",\"query_9\":\"unifi.moffatt.me.\",\"query_1\":\"b8-pkc-l6wr6.europe-west2.gcp.confluent.cloud.\",\"vap\":\"vwire5\",\"query_18\":\"b5-pkc-l6wr6.europe-west2.gcp.confluent.cloud.\",\"query_server_30\":\"192.168.10.1\",\"mac\":\"18:e8:29:eb:30:a0\",\"event_type\":\"dns timeout\",\"assoc_status\":\"0\",\"query_server_1\":\"192.168.10.1\",\"query_server_4\":\"192.168.10.1\",\"query_server_9\":\"192.168.10.1\",\"query_23\":\"api.eu.amazonalexa.com.\",\"query_server_8\":\"192.168.10.1\",\"query_3\":\"asimov.vortex.data.microsoft.com.akadns.net.\",\"query_server_3\":\"192.168.10.1\",\"query_4\":\"asimov.vortex.data.microsoft.com.akadns.net.\",\"query_8\":\"local.\",\"query_server_18\":\"192.168.10.1\",\"query_server_23\":\"192.168.10.1\"}", "processId": null, "messageId": null, "structuredData": null, "deviceVendor": null, "deviceProduct": null, "deviceVersion": null, "deviceEventClassId": null, "date": 1576673484000}
{"name": null, "type": "RFC3164", "message": "Invalid user foo from 192.168.10.83", "host": "usgmoffattme", "version": null, "level": 6, "tag": "sshd", "extension": null, "severity": null, "appName": null, "facility": 4, "remoteAddress": "172.25.0.1", "rawMessage": "<38>Dec 18 12:51:26 usgmoffattme sshd[30243]: Invalid user foo from 192.168.10.83", "processId": "30243", "messageId": null, "structuredData": null, "deviceVendor": null, "deviceProduct": null, "deviceVersion": null, "deviceEventClassId": null, "date": 1576673486000}
{"name": null, "type": "RFC3164", "message": "DHCPREQUEST on eth0 to 62.253.131.171 port 67", "host": "usgmoffattme", "version": null, "level": 6, "tag": "dhclient", "extension": null, "severity": null, "appName": null, "facility": 3, "remoteAddress": "172.25.0.1", "rawMessage": "<30>Dec 18 12:51:35 usgmoffattme dhclient: DHCPREQUEST on eth0 to 62.253.131.171 port 67", "processId": null, "messageId": null, "structuredData": null, "deviceVendor": null, "deviceProduct": null, "deviceVersion": null, "deviceEventClassId": null, "date": 1576673495000}
…
…and filtered it for messages matching a pattern, derived new field of interest, and streamed this to a Kafka topic. All of this is done using SQL - a very expressive and easy-to-use language.
So let’s now take the data we’re using within ksqlDB can also be streamed to other places for use there. Maybe we want to analyse the logs through something like Kibana, so we stream just the SSH attack logs to Elasticsearch. ksqlDB is serving the purpose here of filtering down all syslogs into just a subset of those that we’re interested in examining further:
CREATE SINK CONNECTOR SINK_ELASTIC_SYSLOG WITH (
  'connector.class' = 'io.confluent.connect.elasticsearch.ElasticsearchSinkConnector',
  'connection.url' = 'http://elasticsearch:9200',
  'type.name' = '',
  'behavior.on.malformed.documents' = 'warn',
  'errors.tolerance' = 'all',
  'errors.log.enable' = 'true',
  'errors.log.include.messages' = 'true',
  'topics' = 'SYSLOG_INVALID_USERS',
  'key.ignore' = 'true',
  'schema.ignore' = 'true',
  'key.converter' = 'org.apache.kafka.connect.storage.StringConverter'
);
Maybe we actually want to analyse the full set of syslogs in Kibana - we can do that too. It depends entirely on the use case that we have in mind, and the relative volumes, as to where it makes sense to do the filtering (ksqlDB vs ad-hoc in Kibana):
CREATE SINK CONNECTOR SINK_ELASTIC_ALL_SYSLOG WITH (
  'connector.class' = 'io.confluent.connect.elasticsearch.ElasticsearchSinkConnector',
  'connection.url' = 'http://elasticsearch:9200',
  'type.name' = '',
  'behavior.on.malformed.documents' = 'warn',
  'errors.tolerance' = 'all',
  'errors.log.enable' = 'true',
  'errors.log.include.messages' = 'true',
  'topics' = 'syslog',
  'key.ignore' = 'true',
  'schema.ignore' = 'true',
  'key.converter' = 'org.apache.kafka.connect.storage.StringConverter'
);

We can also model the data in Neo4j to look at the relationship between attacked and attacking hosts:
CREATE SINK CONNECTOR SINK_NEO4J_SSH_ATTACKS_01 WITH (
    'connector.class' = 'streams.kafka.connect.sink.Neo4jSinkConnector',
    'key.converter' = 'org.apache.kafka.connect.storage.StringConverter',
    'topics' = 'SSH_ATTACKS',
    'neo4j.server.uri' = 'bolt://neo4j:7687',
    'neo4j.authentication.basic.username' = 'neo4j',
    'neo4j.authentication.basic.password' = 'connect',
    'neo4j.topic.cypher.SSH_ATTACKS' = 'WITH event WHERE event.HOST is not null MERGE (h:Host{Hostname: event.HOST}) MERGE (a:Attacker{IP: event.ATTACK_IP}) MERGE (u:Username{name: event.ATTACK_USER}) MERGE (u)<-[:USED_LOGIN_ID]-(a)-[:ATTACKED {timestamp: event.SYSLOG_TS, user: event.ATTACK_USER}]->(h)'
  );
What I like about Neo4j is that with the browser you can just poke about the data to understand what it looks like:
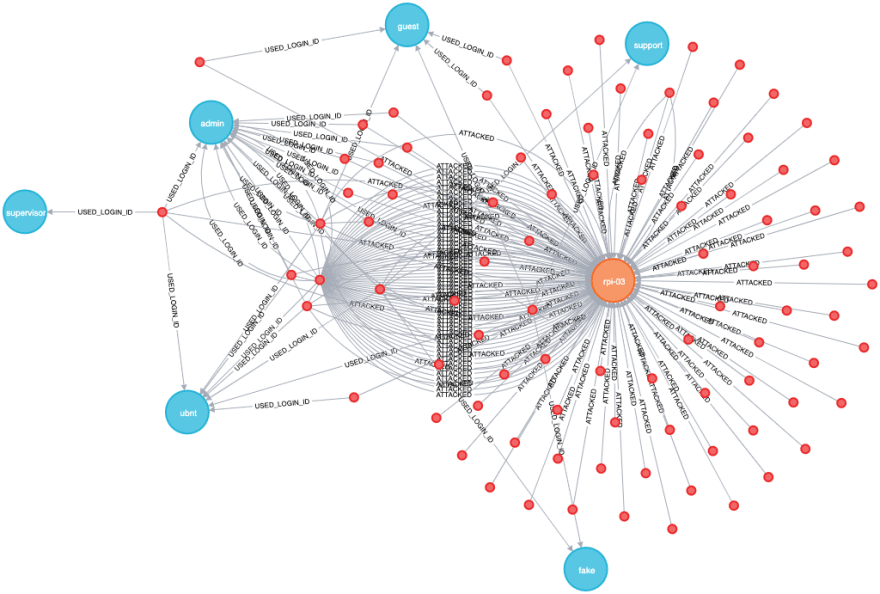
But as you realise certain elements to it you can drop down into Cypher to express a more selective criteria. For example, in digging around the data it became clear that you’ll get some attack hosts that try one or two usernames and then move on, whilst others try many different users:
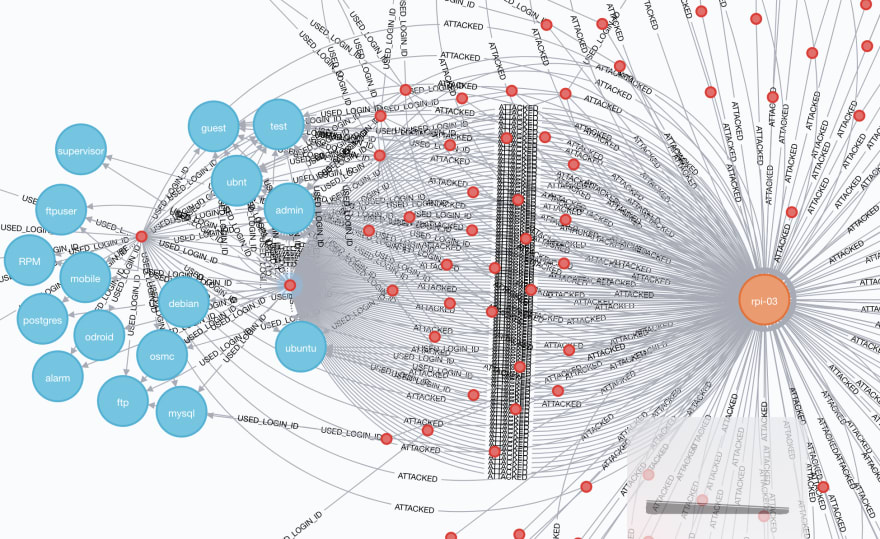
Maybe we want to see how many usernames each attack host uses?
MATCH (u:Username)--(a:Attacker)--(h:Host)
WITH a,h,COUNT(DISINCT u) AS user_count
RETURN DISTINCT a, user_count
ORDER BY user_count DESC

Aggregates and Pull Queries
Let’s get back to ksqlDB to finish with. We’ve got a stream of syslog events coming in, as well as the existing events stored. What else can we do with this data? We can build a stateful aggregation on it:
CREATE TABLE SSH_ATTACKS_BY_USER AS
    SELECT ATTACK_USER,
           COUNT(*) AS ATTEMPTS
      FROM SSH_ATTACKS
  GROUP BY ATTACK_USER;
Here’s the cool thing with ksqlDB. I can ask ksqlDB to tell me when the state changes - this is a push query. It doesn’t end until it is cancelled. When the aggregate changes, I get the new value pushed to me (here the oracle count when from 4 to 5 whilst the query was running):
ksql> SELECT ATTACK_USER, ATTEMPTS FROM SSH_ATTACKS_BY_USER EMIT CHANGES;
+--------------+-----------+
|ATTACK_USER   |ATTEMPTS   |
+--------------+-----------+
|foo           |1          |
|vncserver     |1          |
|hugh          |1          |
|rick          |3          |
|oracle        |4          |
|oracle        |5          |

Press CTRL-C to interrupt
I can also ask ksqlDB what the current state is - this is a pull query, and completes as soon as the value is returned (just like when you run a query against a "normal" database):
ksql> SELECT ATTACK_USER, ATTEMPTS FROM SSH_ATTACKS_BY_USER WHERE ROWKEY='oracle';
+--------------+-----------+
|ATTACK_USER   |ATTEMPTS   |
+--------------+-----------+
|oracle        |5          |
Query terminated
ksql>
You can use the REST API to run this query yourself from within your application. Here’s an example with curl, wrapped with time to show just how quick it is:
$ time curl -s -X POST \
            http://ksqldb-server:8088/query \
            -H 'content-type: application/vnd.ksql.v1+json; charset=utf-8' \
            -d '{"ksql":"SELECT ATTACK_USER, ATTEMPTS FROM SSH_ATTACKS_BY_USER WHERE ROWKEY=\'oracle\';"}' |
        jq -c '.[] | select(.row!=null).row.columns'
        0.06 real 0.00 user 0.00 sys
["oracle",5]
ksqlDB can also do time-based aggregation. How many SSH attacks were there per user by hour?
CREATE TABLE SSH_HOURLY_ATTACKS_BY_USER AS
    SELECT ATTACK_USER,
           COUNT(*) AS ATTEMPTS
      FROM SSH_ATTACKS
           WINDOW TUMBLING (SIZE 1 HOUR)
  GROUP BY ATTACK_USER;
- Push query (server sends clients state as it changes):
ksql> SELECT * FROM SSH_HOURLY_ATTACKS_BY_USER WHERE ROWKEY='admin';
+-----------------+---------------+-------------+----------+
|ROWKEY           |WINDOWSTART    |ATTACK_USER  |ATTEMPTS  |
+-----------------+---------------+-------------+----------+
|oracle           |1576454400000  |oracle       |2         |
|oracle           |1576540800000  |oracle       |4         |
|oracle           |1576627200000  |oracle       |1         |
Query terminated
ksql>
- Pull query (client requests current state from server and then exits):
ksql> SELECT * FROM SSH_HOURLY_ATTACKS_BY_USER WHERE ROWKEY='oracle' AND WINDOWSTART = '2019-12-18T00:00:00';
+-----------------+---------------+-------------+----------+
|ROWKEY           |WINDOWSTART    |ATTACK_USER  |ATTEMPTS  |
+-----------------+---------------+-------------+----------+
|oracle           |1576627200000  |oracle       |1         |
Query terminated
ksql>
ksqlDB & syslog processing : Recap
It’s near real-time.
It’s streaming.
It stores data
It can process historical data
It can reprocess historical data e.g. to refine filters and enrichment processing
It can be used to drive alerts (route messages matching a pattern to a topic, that drives the alert)
It can be used to drive threshold alerts (the SQL clause
HAVINGworks perfectly in ksqlDB)It can be used to stream data down to other targets for further analysis
Get started with ksqlDB at https://ksqldb.io.

Top comments (0)
Some comments may only be visible to logged-in visitors. Sign in to view all comments.