Authored by Kevin Leong
Rockset is a serverless search and analytics engine that makes it easy to develop data-driven apps. This video demo shows an example of what's possible with Rockset. For this exercise, we will build a serverless microservice to discover the stock symbols with the most mentions on Twitter.

Ingest
Our Twitter stream comes from Amazon Kinesis and is continuously ingested into Rockset. It's a simple process to set up a live integration between Rockset and Kinesis from the Rockset console. Refer to our step-by-step guide for more details, including info on setting up the Twitter Kinesis stream.
We also want to combine the stock mentions from Twitter with information about these stocks from Nasdaq. This information comes from a file in Amazon S3 and is ingested into a second Rockset collection.

Query
Rockset automatically infers the schema for the Twitter JSON data in the twitter-firehose collection. We haven't performed any transformation on the data, but we can immediately run SQL queries on it. Examining the results of our SQL query, note how the Twitter data is organized in multiple levels of nesting and arrays.

In our example, we are specifically focused on tweets that contain stock mentions, which we find under the symbols arrays in the entities field. We gradually explore the data and build out our SQL query, joining tweet data with the Nasdaq company info in the tickers collection, to return the most popular stocks in our data set along with some descriptive info about each stock.
Build
Rockset allows you to export your SQL query and embed it as is into your code.
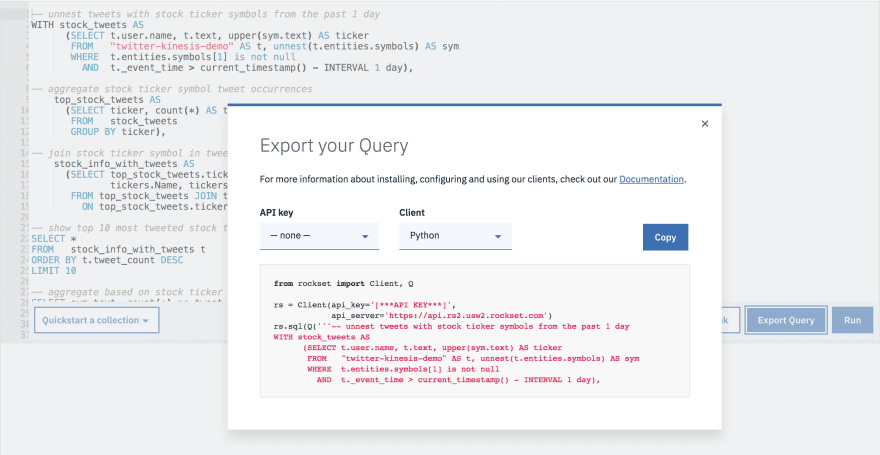
For our demo, we've built a Python-based serverless API, using AWS Lambda, that returns the stock symbols occurring most often in tweets.
Once set up, we can serve live queries on raw, real-time Twitter data. In these results, the company Name, Industry, and MarketCap come from the Nasdaq company info.

We can also build a rudimentary app that calls the API and displays the stock symbols with the most mentions on Twitter for customizable time intervals.

We've provided the code for the Build steps—the Python Lambda function and the dashboard—in our recipes repository, so you can extend or modify this example for your needs.
There's quite a lot going on in this example. We've taken raw JSON and CSV from streaming and static sources, written SQL queries joining the two data sets, used our final SQL query to create a serverless API, and called the API through our app. You can view more detail on how we implemented this serverless microservice in the video embedded above. Hopefully this demo will spur your imagination as you consider what you can build on Rockset.

Top comments (0)