I wrote this post for The New Stack and wanted to share it here on dev.to also.
If you’ve lived with any system long enough, you have assuredly had to debug it. Kubernetes is no different. It is a distributed system with a lot of moving parts and sometimes those parts need to be understood by humans. In this post, we’ll look at 8 commands you can run to start debugging any Kubernetes cluster.
There are lots of optional components in a cluster, but we won’t focus on all of them here. We will discuss troubleshooting workloads in a future article. This post will focus on cluster operations. It will help you understand a cluster and make sure the core functionality — running pods — is available.
This post will assume you have admin access to the cluster. We will pretend you’ve been handed a kubeconfig file with access to a cluster and you were told the cluster is broken. Where do you start?
Here are the eight commands to run:
kubectl version --short
kubectl cluster-info
kubectl get componentstatus
kubectl api-resources -o wide --sort-by name
kubectl get events -A
kubectl get nodes -o wide
kubectl get pods -A -o wide
kubectl run a --image alpine --command -- /bin/sleep 1d
Let’s break down each command to understand why it’s important and what you should be looking for. For cluster debugging, we’re going to take a breadth first approach to understand what is in the cluster before we dive deep into workloads.
kubectl version --short

With this command, we’re looking to see what version of the API server is running. This gives us important information later when we’re troubleshooting specific errors and it’s very useful to know if we’re on an older cluster like 1.16.
Knowing the version can also help us when searching for errors and reading changelogs. There may be known issues that require a version upgrade or a newly introduced bug. There are sometimes version compatibility issues between different components and knowing what version is running is the first step.
kubectl cluster-info

Next we should understand where the cluster is running and if CoreDNS is running. You can parse the control plane URL to know if you’re dealing with a hosted cluster or something on-prem.
In this example output, we can tell that we’re running an Amazon Elastic Kubernetes Service (Amazon EKS) cluster in the us-east-2 region. This information is also useful to look up if there is a current outage with your provider. You can look at your provider's service health dashboard to know if the current issues are with your cluster or something outside of it.
This can also give you a clue if additional authentication will be needed for the cluster. There could be an AWS Identity and Access Management (IAM) permission issue or maybe you need to install an authentication plugin like the aws-iam-authenticator.
kubectl get componentstatus

This command will be the easiest way to discover if your scheduler, controller-manager and etcd node(s) are healthy. These are all critical control plane components to run your pods. You should look for any component that doesn’t show an “ok” status and look for any errors.
If you are using a cluster with a managed control plane (e.g. Amazon EKS) you may not have direct access to the scheduler or controller manager. Being able to see their status from this output is likely the easiest way to know whether something is wrong with etcd or another component.
It’s also important to note that the componentstatus command is deprecated in the CLI but not yet removed. There isn’t currently a replacement for this command, but until it is removed from the CLI it is safe to use and very useful. Depending on your cluster it may require multiple commands to get similar output. There are design limitations to this command which is why it has been deprecated.
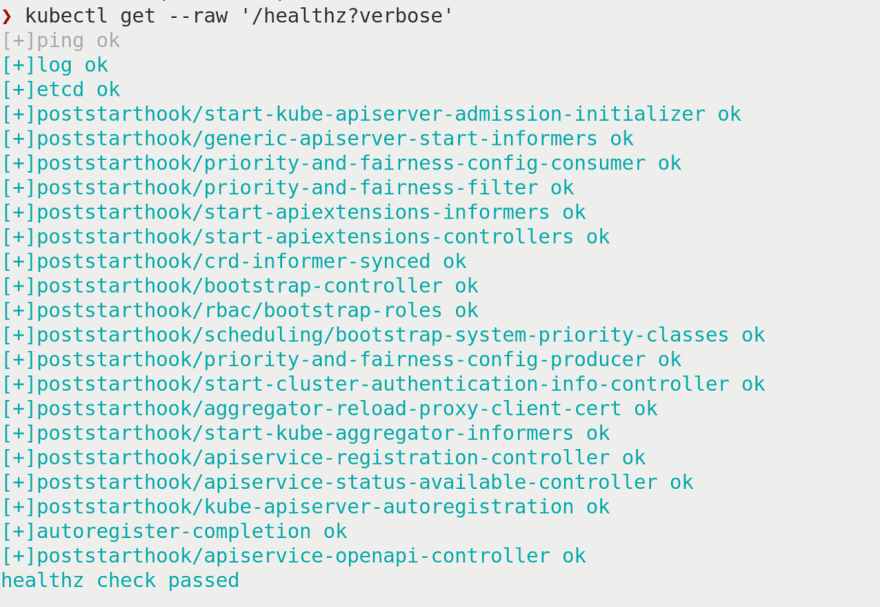
An alternative option to see other health endpoints (including etcd) is kubectl get --raw '/healthz?verbose'
Although this command does not show scheduler or controller-manager output, it adds a lot of additional checks that might be valuable if things are broken.
kubectl api-resources -o wide --sort-by name

This is the first command with a lot of information. We already know what version and where our cluster is running. At this point, we should know whether the control plane is healthy and now we need to look at some of the resources inside the cluster.
I like to list all the resources sorted by name for consistency. It’s easier for me to scan the resources in alphabetical order. Adding -o wide will show the verbs available on each resource. This can be important because some resources do more than others. Knowing what verbs are available — or aren’t — will help narrow down where you should look for errors.
Using this command will tell you what CRDs have been installed in your cluster and what API version each resource is at. This could give you some insights into looking at logs on controllers or workload definitions. Your workloads might be using an old alpha or beta API version but the cluster may only use v1 or apps/v1.
kubectl get events -A
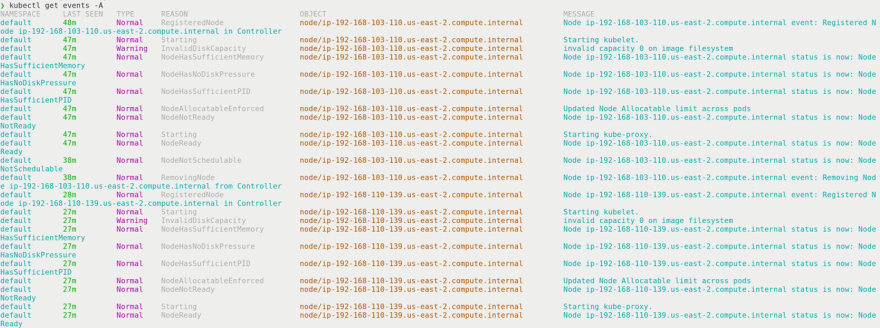
Now that we have an idea of what’s running in the cluster, we should look at what’s happening. If something broke recently, you can look at the cluster events to see what was happening before and after things broke. If you know there’s only a problem in a specific namespace, you can filter the events to just that namespace and block out some of the additional noise from healthy services.
With this output, you should focus on the type of output, reason and object. With those three pieces of information you can narrow down what errors you’re looking for and which component may be misconfigured.
kubectl get nodes -o wide
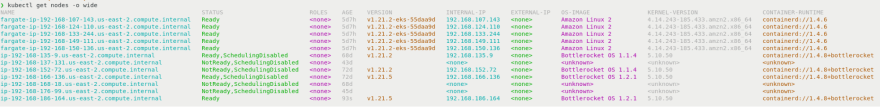
Nodes are a first class resource inside Kubernetes and are fundamental for pods to run. Using the -o wide option will tell us additional details like operating system (OS), IP address, and container runtime. The first thing you should look for is the status. If the node doesn’t say “Ready” you might have a problem — but not always.
Look at the age of the nodes to see whether there’s any correlation between status and age. Maybe only new nodes have problems because something changed in the node image. The version will help you know quickly whether you have version skew on the kubelets and possibly have known bugs because of different versions between the kubelet and API server.
The internal IP can be useful if you see IP addresses outside of the subnet. It’s possible a node started with an incorrect static IP address and your CNI cannot route traffic to a workload.
OS image, kernel version and container runtime are all great indicators for possible differences causing a problem. You may only have a problem with a specific OS or runtime. This information will help you quickly zero in on a potential problem and know where to look deeper at logs.
kubectl get pods -A -o wide

Finally, our last information-gathering command. As with listing nodes, you should first look at the status column and look for errors. The ready column will show how many pods are desired and how many are running.
Using -A will list pods in all namespaces and -o wide will show us IP addresses, nodes and where the pods are nominated. Using the information from listing nodes, you can look at which pods are failing on which nodes. Correlating that information with details like OS, kernel, and container runtime might give you the insights you need to fix the cluster.
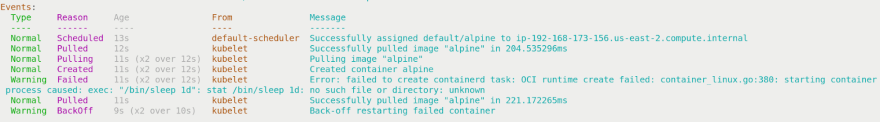
kubectl run a --image alpine --command -- /bin/sleep 1d
Sometimes, the best way you can debug something is to start with the simplest example. This command doesn’t have any direct output, but you should see a running pod named “a” from it.
If I’m not debugging something with other people, I like to name my debug containers single letters because it’s faster to type and it’s easy to iterate (e.g. b, c, d). I often like to keep old containers around while I’m debugging because sometimes it’s helpful to see what’s different with previous pods and it’s easier to leave them running — or crashing — than to search my terminal output history.
If for some reason you don’t see a running pod from this command, then using kubectl describe po a is your next best option. Look at the events to find errors for what may have gone wrong.
Conclusion
With these commands, you should be able to get started with any cluster and know if it’s healthy enough to run a workload. There are additional things to consider such as CoreDNS scaling, load balancing, volumes, and central logging and metrics. The commands here should work in the cloud or on-prem.
If you need to troubleshoot nodes or external resources (e.g. load balancers), then you should look at your controllers and API server logs for errors. Depending on what is broken you may need to look at kube-proxy, CNI plugins or service mesh sidecar container logs.
Hopefully, these 8 commands will help you narrow down the scope of what could be broken in your cluster. If you don’t know what the problem is then starting with a breadth first search is the best approach. Pay attention to anomalies of mismatched versions and nodes or settings that are different. If you look for what has changed it can point you in the right direction to find and fix the problem quickly. We will look at how to debug workloads in your cluster in a future article.

Top comments (0)