Minikube Installation
When starting Minikube, you’ll need to allocate some extra firepower as the plan is to deploy a multi-node Elasticsearch cluster.
minikube start --cpus 4 --memory 8192
You should see output like this:
[Output]
You should see output like this:
Starting local Kubernetes v1.10.0 cluster...
Starting VM...
Getting VM IP address...
Moving files into cluster...
Setting up certs...
Connecting to cluster...
Setting up kubeconfig...
Starting cluster components...
Kubectl is now configured to use the cluster.
Just to verify your single-node Kubernetes cluster is up and running, use:
kubectl cluster-info
[Output]
Kubernetes master is running at https:// 192.168.59.102:8443
CoreDNS is running at https:// 192.168.59.102:8443/api/v1/namespaces/kube-system/services/kube-dns:dns/proxy
To further debug and diagnose cluster problems, Use:
kubectl cluster-info dump
Deploying Elasticsearch
First up, we need to deploy an Elasticsearch instance into our cluster. Normally, Elasticsearch would require 3 nodes to run within its own cluster.
However, since we are using Minikube to act as a development environment, we will configure Elasticsearch to run in single node mode so that it can run on our single simulated Kubernetes node within Minikube.
So, from the terminal, enter the following command to deploy Elasticsearch into our cluster.
C:\Helm>kubectl create -f es-deployment.yaml
[Output]
deployment.apps/es-logging created
C:\Helm>kubectl get deployments
[Output]
NAME READY UP-TO-DATE AVAILABLE AGE
es-logging 1/1 1 1 3m31s
C:\Helm>kubectl get pods
[Output]
NAME READY STATUS RESTARTS AGE
es-logging-5744d89fb9-xhbq7 1/1 Running 0 4m28s
For more information on the status of the Deployment or Pod, use the kubectl describe or kubectl logs commands:
$ kubectl describe deployment es-logging
$ kubectl describe pod es-logging-5744d89fb9-xhbq7
$ kubectl logs –f deployments/es-logging
Exposing Elasticsearch
Now that we have Elasticsearch running in our cluster, we need to expose it so that we can connect other services to it. To briefly explain, this will allow us to expose our Elasticsearch Deployment resource through a Service that will give us the ability to access our Elasticsearch HTTP API from other resources (namely Logstash and Kibana).
Run the following command to expose our Deployment:
C:\Helm>kubectl create -f es-svc.yaml
[Output]
service/es-service created
This will have created a Kubernetes Service resource that exposes the port 9200 from our Elasticsearch Deployment resource, Elasticsearch’s HTTP port. This port will now be accessible through a port assigned in the cluster. To see this Service and the external port that has been assigned, run the following command:
C:\Helm>kubectl get svc
[Output]
NAME TYPE CLUSTER-IP EXTERNAL-IP PORT(S) AGE
es-service NodePort 10.97.114.162 9200:32375/TCP 6s
kubernetes ClusterIP 10.96.0.1 443/TCP 54m
C:\Helm>minikube service es-service
[Output]
|-----------|------------|-------------|-----------------------------|
| NAMESPACE | NAME | TARGET PORT | URL |
|-----------|------------|-------------|-----------------------------|
| default | es-service | 9200 | http://192.168.59.102:32375 |
|-----------|------------|-------------|-----------------------------|
- Opening service default/es-service in default browser...
To get Minikube IP:
C:\Helm>minikube ip
[Output]
192.168.59.102
As you can see, our Elasticsearch HTTP port has been mapped to external port 32375. Since we are running through Minikube, the external port will be for that virtual machine, so we will use the Minikube IP address and external port to check that our setup is working correctly.
[Browser Output]
{
"name" : "es-logging-5744d89fb9-xhbq7",
"cluster_name" : "docker-cluster",
"cluster_uuid" : "XKT9bYwCR1CencccW6JggQ",
"version" : {
"number" : "7.8.0",
"build_flavor" : "default",
"build_type" : "docker",
"build_hash" : "757314695644ea9a1dc2fecd26d1a43856725e65",
"build_date" : "2020-06-14T19:35:50.234439Z",
"build_snapshot" : false,
"lucene_version" : "8.5.1",
"minimum_wire_compatibility_version" : "6.8.0",
"minimum_index_compatibility_version" : "6.0.0-beta1"
},
"tagline" : "You Know, for Search"
}
To check health point setup for liveness and readiness probes, Run:
http://192.168.59.102:32375/_cluster/health
[Output]
{"cluster_name":"docker-cluster","status":"green","timed_out":false,"number_of_nodes":1,"number_of_data_nodes":1,"active_primary_shards":0,"active_shards":0,"relocating_shards":0,"initializing_shards":0,"unassigned_shards":0,"delayed_unassigned_shards":0,"number_of_pending_tasks":0,"number_of_in_flight_fetch":0,"task_max_waiting_in_queue_millis":0,"active_shards_percent_as_number":100.0}
Deploying Kibana
Now that we have an Elasticsearch instance running and accessible via the Minikube IP and assigned port number, we will spin up a Kibana instance and connect it to Elasticsearch. We will do this in the same way we have setup Elasticsearch: creating another Kubernetes Deployment resource.
C:\Helm>kubectl create -f kibana-deployment.yaml
[Output]
deployment.apps/kibana-logging created
C:\Helm>kubectl get deployment kibana-logging
`[Output]`

> NAME READY UP-TO-DATE AVAILABLE AGE
> kibana-logging 1/1 1 1 70s

Like with the Elasticsearch instance, our Kibana instance isn’t going to work straight away. The reason for this is that it doesn’t know where the Elasticsearch instance is running. By default, it will be trying to connect using the URL http://elasticsearch:9200. You can see this by checking in the logs for the Kibana pod.
C:\Helm>kubectl get pods
`[Output]`

> NAME READY STATUS RESTARTS AGE
> es-logging-5744d89fb9-xhbq7 1/1 Running 0 33m
> kibana-logging-5dc77584cc-7jfnt 1/1 Running 0 2m13s
C:\Helm>kubectl logs kibana-logging-5dc77584cc-7jfnt
`[Output]
`
> {"type":"log","@timestamp":"2022-03-28T10:15:18Z","tags":["warning","elasticsearch","admin"],"pid":11,"message":"Unable to revive connection: http://elasticsearch:9200/"}

The URL of the Elasticsearch instance is defined via an environment variable in the Kibana Docker Image, just like the mode for Elasticsearch. However, the actual key of the variable is ELASTICSEARCH_HOSTS, which contains all valid characters to use the kubectl command for changing an environment variable in a Deployment resource. Since we now know we can access Elasticsearch’s HTTP port via the host mapped port 32375 on the Minikube IP, we can update Kibana to point to the Elasticsearch instance.
C:\Helm>minikube ip
`[Output]`

> 192.168.59.102

Then, set environment variable using below command
kubectl set env deployments/kibana-logging ELASTICSEARCH_HOSTS=http://$(minikube ip):elasticsearch-Node-port
for e.g
C:\Helm>kubectl set env deployments/kibana-logging ELASTICSEARCH_HOSTS=http://192.168.59.102:32375
`[Output]`
> deployment.apps/kibana-logging env updated

Note: We don’t need to use the Minikube IP to allow our components to talk to each other. Because they are living within the same Kubernetes cluster, we can use the Cluster IP assigned to each Service resource (run kubectl get services to see what the Cluster IP addresses are). This is particularly useful if your setup returns the localhost IP address for your Minikube installation. In this case, you will not need to use the Node Port, but instead use the actual container port.

This will trigger a change in the deployment, which will result in the existing Kibana Pod being terminated, and a new Pod (with the new environment variable value) being spun up. If you run kubectl get pods again, you should be able to see this new Pod now. Again, if we check the logs of the new Pod, we should see that it has successfully connected to the Elasticsearch instance and is now hosting the web UI on port 5601.
C:\Helm>kubectl logs -f pod/kibana-logging-59d555748b-mg76x
`[Output]`

> {"type":"log","@timestamp":"2022-03-28T10:51:14Z","tags":["listening","info"],"pid":9,"message":"Server running at http://0:5601"}
> {"type":"log","@timestamp":"2022-03-28T10:51:15Z","tags":["info","http","server","Kibana"],"pid":9,"message":"http server running at http://0:5601"}

## Accessing the Kibana UI

Now that we have Kibana running and communicating with Elasticsearch, we need to access the web UI to allow us to configure and view logs. We have already seen that it is running on port 5601, but like with the Elasticsearch HTTP port, this is internal to the container running inside of the Pod. As such, we need to also expose this Deployment resource via a Service.
C:\Helm>kubectl create -f kibana-svc.yaml
`[Output]`

> service/kibana-service created
> We should now be able to view the web UI using the same Minikube IP as before and the newly mapped port. Look at the new service to get the mapped port.
C:\Helm>kubectl get services
`[Output]`

> NAME TYPE CLUSTER-IP EXTERNAL-IP PORT(S) AGE
> es-service NodePort 10.97.114.162 <none> 9200:32375/TCP 32m
> kibana-logging NodePort 10.105.131.15 <none> 5601:32457/TCP 8s
> kubernetes ClusterIP 10.96.0.1 <none> 443/TCP 87m
C:\Helm>minikube service kibana-service
`[Output]`
> |-----------|----------------|-------------|-----------------------------|
> | NAMESPACE | NAME | TARGET PORT | URL |
> |-----------|----------------|-------------|-----------------------------|
> | default | kibana-service | 5601 | http://192.168.59.102:32417 |
> |-----------|----------------|-------------|-----------------------------|
> * Opening service default/kibana-logging in default browser...
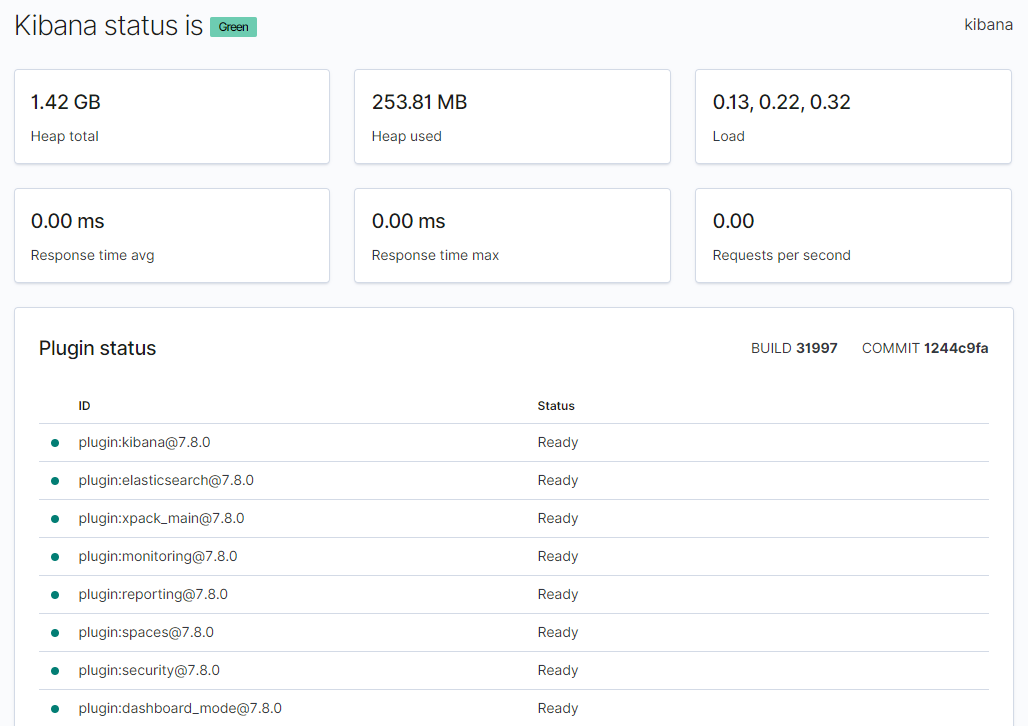
> Now navigate in the browser to the URL: “http://192.168.59.102:32417/status” to check that the web UI is running and Elasticsearch is connected properly.
## Deploying Logstash
The next step is to get Logstash running within our setup. Logstash will operate as the tool that will collect logs from our application and send them through to Elasticsearch. It provides various benefits for filtering and re-formatting log messages, as well as collecting from various sources and outputting to various destinations. For this tutorial, we are only interested in using it as a pass-through log collector and forwarder.
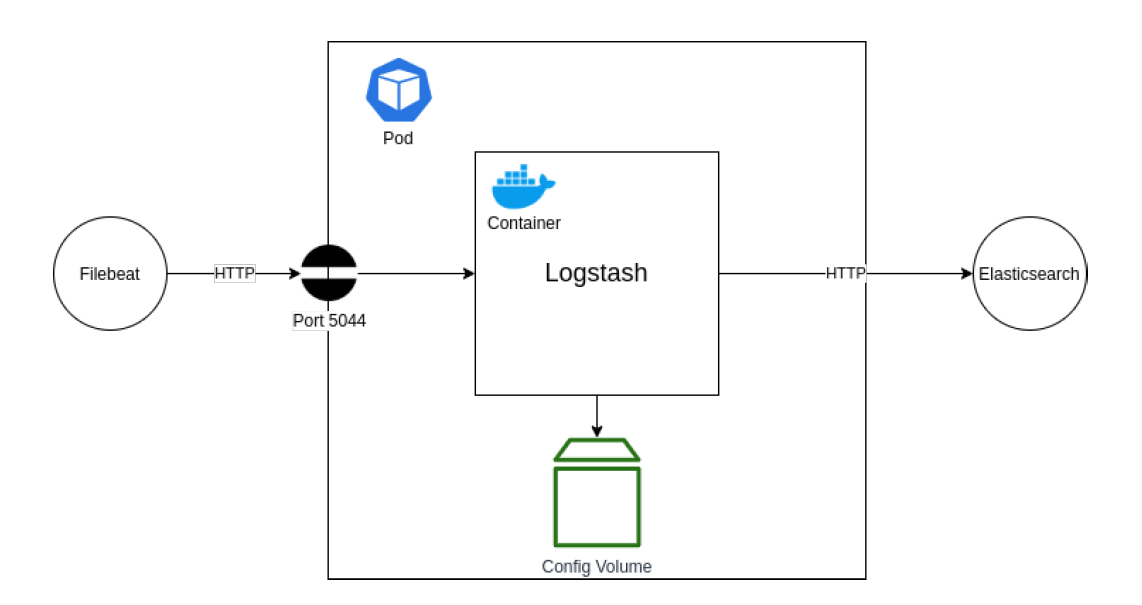
In the above diagram, you can see our desired setup. We are aiming to deploy a Logstash container into a new Pod. This container will be configured to listen on port 5044 for log entries being sent from a Filebeat application (more on this later). Those log messages will then be forwarded straight onto our Elasticsearch instance that we setup earlier, via the HTTP port that we have exposed.
To achieve this setup, we are going to have to leverage the Kubernetes YAML files. This is a more verbose way of creating deployments and can be used to describe various resources (such as Deployments, Services, etc.) and create them through a single command. The reason we need to use this here is that we need to configure a volume for our Logstash container to access, which is not possible through the CLI commands. Similarly, we could have also used this approach to reduce the number of steps required for the earlier setup of Elasticsearch and Kibana; namely the configuration of environment variables and separate steps to create Service resources to expose the ports into the containers.
Create a file called logstash.conf and enter the following:
`Note: Please update the minikube_ip:elasticsearch-nodeport`
input {
beats {
port => "5044"
}
}
output {
elasticsearch {
hosts => ["http://192.168.99.102:30445"]
index => "%{[@metadata][beat]}-%{[@metadata][version]}-%{+YYYY.MM.dd}"
}
stdout {
codec => rubydebug
}
}
Next, we need to create a new file called deployment.yml. Enter the following Kubernetes Deployment resource YAML contents to describe our Logstash Deployment.

we need to create this ConfigMap. This volume will contain the logstash.conf file we have created, which will be mapped to the pipeline configuration folder within the Logstash container. This will be used to configure our required pass-through pipeline. So, run the following command:
C:\Helm>kubectl create configmap log-manual-pipeline --from-file ./logstash.conf
`[Output]`

> configmap/log-manual-pipeline created

We can now create the Deployment resource from our logstash-deployment.yml file.
C:\Helm>kubectl create -f logstash-deployment.yml
`[Output]`

> deployment.apps/logstash-logging created

Note: You may notice errors stating there are “No Available Connections” to the Elasticsearch instance endpoint with the URL http://elasticsearch:9200/. This comes from some default configuration within the Docker Image, but does not affect our pipeline, so can be ignored in this case.

## Expose the Logstash Filebeats port

Now that Logstash is running and listening on container port 5044 for Filebeats log message entries, we need to make sure this port is mapped through to the host so that we can configure a Filebeats instance in the next section. To achieve this, we need another Service resource to expose the port on the Minikube host. We could have done this inside the same deployment.yml file, but it’s worth using the same approach as before to show how the resource descriptor and CLI commands can be used in conjunction.
C:\Helm>kubectl create -f logstash-svc.yml
`[Output]`

> service/logstash-service created
C:\Helm>kubectl get svc
`[Output]`
> NAME TYPE CLUSTER-IP EXTERNAL-IP PORT(S) AGE
> es-service NodePort 10.97.114.162 <none> 9200:32375/TCP 74m
> kibana-service NodePort 10.105.131.15 <none> 5601:32457/TCP 15m
> kubernetes ClusterIP 10.96.0.1 <none> 443/TCP 129m
> logstash-service NodePort 10.110.161.161 <none> 5044:31810/TCP 13s
As you can see, the container port 5044 has been mapped to port 31810 on the host. Now we can move onto the final step: configuring our application and a Sidecar Filebeats container to pump out log messages to be routed through our Logstash instance into Elasticsearch.
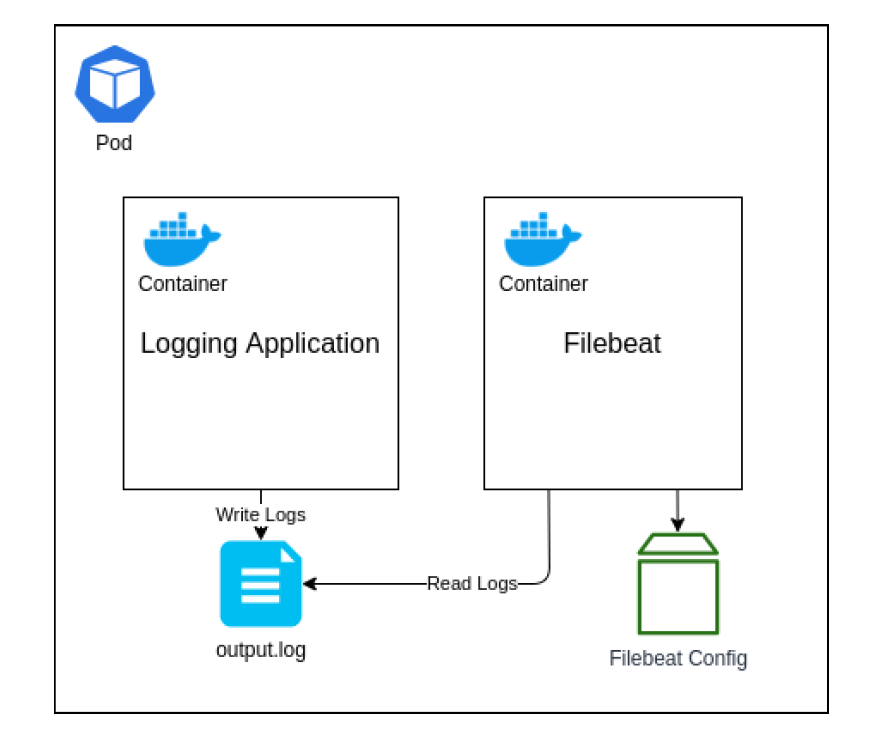
## Application Deployment
There are several different ways we could structure this, but the approach I am going to walk through is by deploying both our application and the Filebeat instance as separate containers within the same Pod. We will then use a Kubernetes volume known as an Empty Directory to share access to the log file that the application will write to and Filebeats will read from. The reason for using this type of volume is that its lifecycle will be directly linked to the Pod. If you wish to persist the log data outside of the Pod, so that if the Pod is terminated and re-created the volume remains, then I would suggest looking at another volume type, such as the Local volume.
To begin with, we are going to create the configuration file for the Filebeats instance to use. Create a file named filebeat.yml and enter the following contents.
`Note: Please update the minikube_ip:logstash-nodeport`
filebeat.inputs:
- type: log paths:
- /tmp/output.log output: logstash: hosts: [ "192.168.99.102:31010" ]
This will tell Filebeat to monitor the file /tmp/output.log (which will be located within the shared volume) and then output all log messages to our Logstash instance (notice how we have used the IP address and port number for Minikube here).

Now we need to create a ConfigMap volume from this file.
C:\Helm>kubectl create configmap beat-manual-config --from-file ./filebeat.yml
`[Output]`

> configmap/beat-manual-config created

Next, we need to create our Pod with the double container setup. For this, like the last section, we are going to create a app-deployment.yml file.

To create this Deployment resource, run the following command:
C:\Helm>kubectl create -f app-deployment.yml
`[Output]`

> deployment.apps/logging-app-manual created

Both containers will share a folder mapped to the /tmp path, which is where the log file will be written to and read from. The Filebeat container will also use the ConfigMap volume that we have just created, which we have specified for the Filebeat instance to read the configuration file from; overwriting the default configuration.

You will also notice that our application container is using the Docker Image sladesoftware/log-application:latest. This is a simple Docker Image that builds on an Alpine Linux image and runs an infinite loop command that appends a small JSON object to the output file every few seconds.
C:\Helm>minikube service kibana-service
`[Output]`
> |-----------|----------------|-------------|-----------------------------|
> | NAMESPACE | NAME | TARGET PORT | URL |
> |-----------|----------------|-------------|-----------------------------|
> | default | kibana-service | 5601 | http://192.168.59.102:32457 |
> |-----------|----------------|-------------|-----------------------------|
> * Opening service default/kibana-service in default browser...
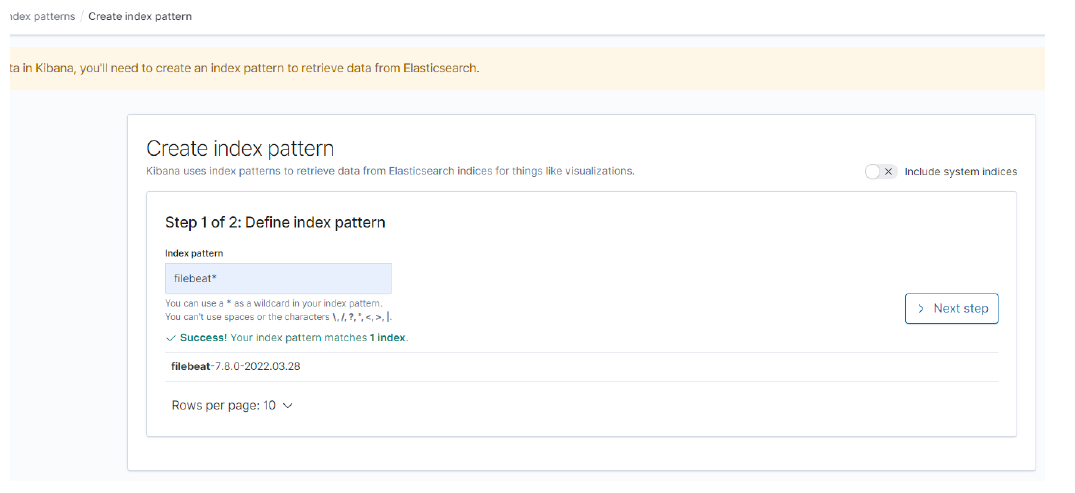
> You should now be able to browse to the Kibana dashboard in your web browser to view the logs coming in. Make sure you first create an Index Pattern to read these logs – you should need a format like filebeat*.
Once you have created this Index Pattern, you should be able to view the log messages as they come into Elasticsearch over on the Discover page of Kibana.
Here is the git repository.
https://github.com/sagary2j/ELK-Stack-Kubernetes-minikube

Top comments (7)
Hello mate, it's possible share yaml manifests used?
Hi @rmnobarra, Apologies for the delay. Here is the git repository.
github.com/sagary2j/ELK-Stack-Kube...
Hey @leo Thanks a lot for mentioning that. I will get back to you with yaml manifests.
please share yaml file :-)
Here is the git repository.
github.com/sagary2j/ELK-Stack-Kube...
Hi Sagar, can you please advise me as to where I can find the yaml manifest files for the above deployment?
Here is the git repository.
github.com/sagary2j/ELK-Stack-Kube...