In a MySQL hosting replication setup, the parameter Seconds_Behind_Master (SBM), as displayed by the SHOW SLAVE STATUS command, is commonly used as an indication of the current replication lag of the slave. In this blog post, we examine how to understand and interpret the MySQL Seconds Behind Master value in various situations.
Possible Values of Seconds Behind Master
The value of SBM, as explained in the MySQL documentation, depends on the state of the MySQL slave in general, and the states of MySQL slave SQL_THREAD and IO_THREAD in particular. While IO_THREAD connects with the master and reads the updates, SQL_THREAD applies these updates on the slave. Let’s examine the possible values of SBM during different states of the MySQL Slave.
When SBM Value is Null
- SBM is always NULL if your slave is stopped, or your SQL Thread is stopped (or not running).
- SBM will also be NULL if the IO Thread is stopped, provided the SQL Thread has already processed all events from the relay log. A sample output of SHOW SLAVE STATUS (trimmed to show only values of interest) demonstrates this:
Slave_IO_State:
Master_Host: 172.19.0.13
Slave_IO_Running: No
Slave_SQL_Running: Yes
Seconds_Behind_Master: NULL
Master_UUID: 23b326b1-a452-11e8-91ca-000d3a065e8e
Slave_SQL_Running_State: Slave has read all relay log; waiting for more updates
Retrieved_Gtid_Set: 23b326b1-a452-11e8-91ca-000d3a065e8e:818-389213
Executed_Gtid_Set: 23b326b1-a452-11e8-91ca-000d3a065e8e:1-389213
When SBM Value is Zero or Positive
- SBM is going to reflect a valid value (>= 0) when the SQL Thread is actively processing events. This is true irrespective of the IO Thread state. For instance:
Slave_IO_State:
Master_Host: 172.19.0.13
Slave_IO_Running: No
Slave_SQL_Running: Yes
Seconds_Behind_Master: 3399
Master_UUID: 23b326b1-a452-11e8-91ca-000d3a065e8e
Slave_SQL_Running_State: Waiting for slave workers to process their queues
Retrieved_Gtid_Set: 23b326b1-a452-11e8-91ca-000d3a065e8e:818-389213
Executed_Gtid_Set: 23b326b1-a452-11e8-91ca-000d3a065e8e:1-118774
In the above example, we can see that slave is behind the master by comparing the Retrieved_GTID_Set and the Executed_GTID_Set. In such cases, Seconds_Behind_Master will represent the difference between the timestamp of the latest transaction processed by the SQL Thread and the timestamp of the same transaction when it was processed on the master. This transaction timestamp of the master is preserved through replication and hence the slave will be able to compute the SBM locally.
Also, once the slave fully catches up with all the relay logs, (i.e. executed GTID becomes 23b326b1-a452-11e8-91ca-000d3a065e8e:1-389213/), Seconds_Behind_Master will turn to ‘0’ if the IO Thread is running, or to ‘NULL’ if IO Thread is not running.
Understanding Execution Speed of the MySQL Slave
Assuming that the SQL Thread and IO Thread on the slave are in running states, it’s possible to understand the relative execution speeds of the master and the slave by monitoring the SBM value. A consistent ‘0’ value or a constant value indicates that the slave is executing at the same speed as the master. On the other hand, an upward slope for Seconds_Behind_Master indicates that the slave is performing slower than the master.
ScaleGrid’s Monitoring Console for MySQL on Azure plots the values of SBM over time for the slave nodes.
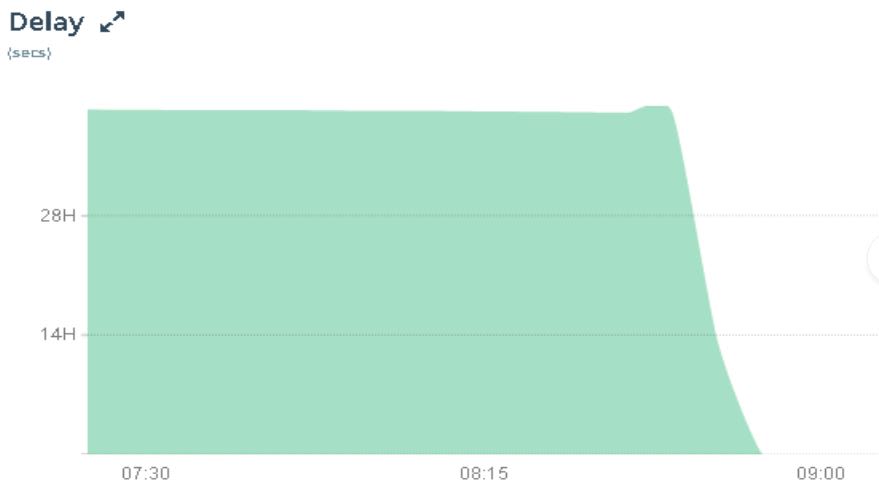
Zero Or Constant Value of SBM
In the above example, the slave was started about 40 hours after the master had active writes. Once started, the slave began replicating that data, and we see the SBM was pretty flat indicating the slave executed at the same speed as the master. Also note the fall of SBM to ‘0’ is steep, which really means that though the last transaction the slave ran was executed about 40 hours before on the master, once we have caught up, there is ‘0’ delay.
Increasing Values of SBM
In the graph below, we can see that SBM is constantly increasing, which means that the slave’s execution speed is less compared to that of the master. This is actually a case where we are running 20 threads doing continuous writes on the master and a single-threaded slave is not able to keep pace with it.
Lastly, it’s important to note that in our discussions so far, we have not assumed any network bottlenecks. In case of slow networks, the slave IO Thread itself will be lagging behind the master, and if the SQL Thread is fast enough, the SBM will be oscillating between ‘0’ and a positive number. In such cases, SBM will not be a useful parameter to understand the real lag with the master.
If your MySQL deployments are setup using semisynchronous replication, you can also check out our MySQL High Availability Framework Explained - Part II post to learn more about managing the execution speed of your slaves.


Top comments (0)